LATE BLIGHT OF CELERY (Septoria Apiicola) - Santa Barbara ...
LATE BLIGHT OF CELERY (Septoria Apiicola) - Santa Barbara ...
LATE BLIGHT OF CELERY (Septoria Apiicola) - Santa Barbara ...

Create successful ePaper yourself
Turn your PDF publications into a flip-book with our unique Google optimized e-Paper software.
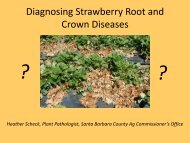
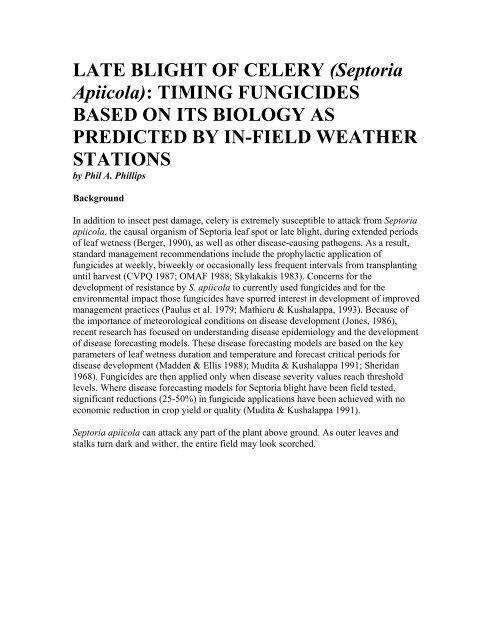
<strong>LATE</strong> <strong>BLIGHT</strong> <strong>OF</strong> <strong>CELERY</strong> (<strong>Septoria</strong><strong>Apiicola</strong>): TIMING FUNGICIDESBASED ON ITS BIOLOGY ASPREDICTED BY IN-FIELD WEATHERSTATIONSby Phil A. PhillipsBackgroundIn addition to insect pest damage, celery is extremely susceptible to attack from <strong>Septoria</strong>apiicola, the causal organism of <strong>Septoria</strong> leaf spot or late blight, during extended periodsof leaf wetness (Berger, 1990), as well as other disease-causing pathogens. As a result,standard management recommendations include the prophylactic application offungicides at weekly, biweekly or occasionally less frequent intervals from transplantinguntil harvest (CVPQ 1987; OMAF 1988; Skylakakis 1983). Concerns for thedevelopment of resistance by S. apiicola to currently used fungicides and for theenvironmental impact those fungicides have spurred interest in development of improvedmanagement practices (Paulus et al. 1979; Mathieru & Kushalappa, 1993). Because ofthe importance of meteorological conditions on disease development (Jones, 1986),recent research has focused on understanding disease epidemiology and the developmentof disease forecasting models. These disease forecasting models are based on the keyparameters of leaf wetness duration and temperature and forecast critical periods fordisease development (Madden & Ellis 1988); Mudita & Kushalappa 1991; Sheridan1968). Fungicides are then applied only when disease severity values reach thresholdlevels. Where disease forecasting models for <strong>Septoria</strong> blight have been field tested,significant reductions (25-50%) in fungicide applications have been achieved with noeconomic reduction in crop yield or quality (Mudita & Kushalappa 1991).<strong>Septoria</strong> apiicola can attack any part of the plant above ground. As outer leaves andstalks turn dark and wither, the entire field may look scorched.
Germinating <strong>Septoria</strong> spores can penetrate directly through the epidermis as well asthrough stomata and as readily on the upper surface of leaves as on the lower surface,although there are only about one-third as many stomata on the upper surface.In polycyclic diseases (those that pass through multiple disease cycles during a givencropping period), such as <strong>Septoria</strong> late blight in celery, the initial inoculum, althoughimportant, is minor when compared to the existing rate parameters of temperature andleaf wetness duration when predicting final disease levels (Fry 1982). In other words, theneed for disease suppressive treatments will depend more on the occurrence of optimumtemperature and leaf wetness conditions than on whether the initial inoculum load in thefield was heavy or light. However, if a celery field has high inoculum levels attransplanting, as in the case of infected plants coming from the nursery, there is no roomfor error in the choice and timing of disease management practices as compared to a fieldwith low inoculum levels.Current SituationOver the last several years, Campbell Soup's Research Department has successfully useda <strong>Septoria</strong> forecasting model (patterned after the "Tom-Cast" model for Alternaria blighton tomato) with its celery growers who have saved one or more fungicide applicationswith each crop (Bob Curtis, Campbell's Research Dept., pers. comm.). Probably moreimportant than saving the costs of fungicide applications, which weren't needed, is theincreased accuracy in timing fungicide applications when they are needed. Since themodel links the timing of fungicide applications with the potential for diseasedevelopment as it is measured on site in the celery field, fungicides can be applied moreon an as needed basis than on a purely calendar or best guess basis.There are a number of manufacturers offering various weather measuring instrumentationand software packages, which can be used to forecast disease development and timefungicide applications (see accompanying annotated list).At the low tech end, a simple logger with a temperature and a leaf wetness probe alongwith some hand calculations will suffice.The Model - How it WorksThe <strong>Septoria</strong> model is really very simple. It operates under the premise that within giventemperature ranges there are specific requirements (thresholds) for consecutive hours ofleaf wetness before spore development and germination can take place. This is analogousto degree-day models for insects, which depend on a known temperature threshold fordevelopment for the organism in question (see Information Series #1). Each day thattemperature and leaf wetness conditions exceed the lower thresholds, a certain number ofDSV's (disease severity values) are contributed to the progress of the disease. Aconservative accumulation of 20 DSV's is currently used to determine the timing forfungicide applications. It is likely that with additional research, this threshold can berelaxed to 25 or 30 DSV's accumulated before fungicide application is warranted.
Table #1 is the basic model. On the left side of the table are the temperature ranges withinwhich different disease severity values are assigned depending upon the hours of leafwetness occurring each day. The body of the table consists of various periods of leafwetness. Thus, by calculating the average temperature (the table uses Centigrade) duringthe period of leaf wetness, one can read across the table from the calculated averagetemperature to the appropriate period of measured leaf wetness and then follow up thetable to obtain the corresponding DSV located at the top of the table.An example is presented in Figure #2. Here, the leaf wetness probe being used has athreshold level of 10 for wetness. Levels below 10 are considered dry, while 10 andabove are considered wet. Thus, on 6/21 the hours of leaf wetness were from 1730 (5:30
pm) until 0830 (am) the following day for a totalof 16 hours. For calculating leaf wetness hoursone "day" usually runs from noon-to-noon (noonone day to noon the following day), sincewetness often occurs over night. The averagetemperature for this wetness period was 16degrees C, well above the lower criticalthreshold of 13°C for <strong>Septoria</strong> development.Using Table #1, a period of 16 hours of leafwetness at 16°C average temperature during thisperiod contributes "2" DSV's to the "life cycle"of the pathogen.Figure #3 shows a situation where, despite alengthy leaf wetness period of 14 hours, noDSV's were contributed to the pathogen "cycle"because the average temperature was below the13°C threshold.Table #2 gives an example of how the model isactualy used. Here, the celery grower has asimple data logger located in his celery field. Hehas a temperature probe and a leaf wetness probeattached to the logger and placed within the celery canopy. Monitoring began attransplanting on 3/24/95, but temperatures were too cool to generate DSV's until 4/4/95.Most other dates with temperatures below 13°C during the leaf wetness period are alsoleft off the table. Those dates which contributed DSV's to the pathogen's cycle are shownin this table. A treatment threshold level of 20 DSV's wasn't reached until 5/3/95, with thefungicide being applied early in the morning on 5/7/95. Thus, the accumulation startsagain from this point until 5/31/95, when an accumulation of 19 was reached and adecision to treat again was made. This process continued throughout the crop cycle,retreating approximately every 20 DSV's.Fungicide application timing decisions must obviously be based on more than just whatthis model predicts. Considerations of insecticide timing, irrigation scheduling, andpredicted harvest date all play a role in the final decision as to when to apply a fungicide.Table 3 gives a few sources for microclimatic measuring weather stations and probes.
Works CitedBerger, R.D. 1970. Epiphytology of celery late blight. Florida State Hort.Soc.Proc.83:208-212.CPVQ (Conseil des productions vegetales du Quebec). 1987. Legumes, Protection AGDEX 250-605.Ministere de l' Agriculture, del Pecheries et de l'Alimentation du Quebec. 112 pp.Fry, W. E. 1982. Principles of Plant Disease Management. Academic Press, New York.Jones, A.L. 1986. Role of wet periods in predicting foliar diseases. Pages 87-100 IN: Plant DiseaseEpidemiology, Population Dynamics and Management. K.J. Leonard and W.E. Fry, ed. MacMillanPublishing Co., New York.Madden, L., S.P. Pennypacker, and A.A. MacNab. 1978. FAST, a forecast system for Alternaria solanion tomato. Phytopathology 68:1354-1358.Madden, L.V. and M.A. Ellis. 1988. How to develop plant disease forecasters. Pages 191-207 in:Experimental Techniques in Plant Disease Epidemiology. J. Kranz and J. Rotem, ed. Springer-Verlag, NewYork.Mathieu, D. and A.C. Kushalappa. 1991. Effects of temperature and leaf wetness duration on theinfection of celery by <strong>Septoria</strong> apiicola. Phytopathology 83(10):1036-1040.Mudita, W. and A.C. Kushalappa. 1991. Effect of media and temperature on sporulation of <strong>Septoria</strong>apiicola, and of inoculum density on <strong>Septoria</strong> blight severity in celery. Phytoprotection 72:97-103.
Ontario Ministry of Agriculture and Food. 1988. Vegetable Production Recommendations. OMAF Publ.363. 78 pp.Paulus, A., J. Nelson, and H. Otto. 1979. Combination versus single fungicides for control of <strong>Septoria</strong>leaf spot in celery. Cal. Ag. 33:15.Sheridan, J.E. 1968. Conditions for germination of pycnidiospores of <strong>Septoria</strong> apiicola. Spec. N.A. J. Bot.6:315-322.Skylakakis, G. 1983. Theory and strategy of chemical control. Ann. Rev. Phytopathol. 21:117-135.This publication was made possible, in part, through a funding grant from theCal/EPA, Department of Pesticide Regulation, Pest Management Analysis andPlanning Program, and the U.S. Environmental Protection Agency.Franklin Laemmlen, UC FarmAdvisor624 West Foster RoadPhil Phillips, UC FarmAdvisor669 County Square Drive,#100Julie Newman, UC FarmAdvisor660 County Square Drive,#100<strong>Santa</strong> Maria, CA 93455 Ventura, CA 93003 Ventura, CA 93003