


-
Over the past century, utilization of dwarfing or size-controlling rootstocks has modernized perennial tree fruit orchard systems, enabling high-density plantings that reduce input costs, and increase efficiencies of labor use and yield, ultimately resulting in higher profitability[1−3]. While commercial apple (Malus domestica Borkh.) production has benefited from widespread use of dwarfing Malus rootstocks, the closely related pear (European; Pyrus communis L.) lacks comparable dwarfing Pyrus rootstocks[4]. In most US pear orchards, three-dimensional trees on semi-to-vigorous rootstocks are planted at low densities of 500 to 1,800 trees per hectare[5]. Though quince (Cydonia oblonga Mill.) is widely used as a size-controlling rootstock in global pear production (particularly in Europe), concerns of cold-hardiness and graft incompatibility have precluded its adoption in the US.
Elucidation of the genetic basis of rootstock-conferred dwarfing in pome fruit has been mostly conducted on apple. The major dwarfing locus Dw1 that was mapped on chromosome 5 of 'Malling 9' did not fully explain the phenotypic variation of Dw1-carrying vigorous offspring[6]. Another dwarfing locus, Dw2 was subsequently mapped on chromosome 11[7]. Presence of homozygous non-dwarfing alleles at either Dw1 or Dw2 nullified the dwarfing effect at the other locus in one segregating progeny but acted independently in another segregating progeny. Foster et al.[8] described Dw2 as an enhancer of Dw1 with a smaller effect, but Dw2 alone does not confer dwarfing. However, Dw2 identified by Foster et al.[8] differed in position from Dw2 by Fazio et al.[7]. In the three studies above[6−8], rootstock-conferred traits, such as trunk cross-sectional area, were phenotyped and used in quantitative trait locus (QTL) mapping. In a different study where root bark percentage was used as a phenotype, a third dwarfing locus was mapped on chromosome 13, and dwarfing was proposed as a three-locus model[9].
In contrast, genetic analysis of pear dwarfing has been limited. In pear literature, the terms dwarf and dwarfing are sometimes used interchangeably, but an important distinction is noteworthy. 'Dwarf' refers to the compact stature or growth habit of a tree, while 'dwarfing' denotes a scion's reduced vigor that is conferred by the rootstock. A dwarf locus PcDw was mapped on chromosome 16 of P. communis 'Aihuali'[10], a dwarf offspring of PcDw-carrying 'Nain Vert'. To date, there has only been one genetic analysis of pear dwarfing. Dwarfing loci were detected on chromosomes 5 and 6 of P. communis 'Old Home'[11]. The chromosome 5 locus was orthologous to the Malus Dw1 locus, suggesting potential gene derivation from the same source, prior to the divergence of apple and pear. Our limited understanding of the genetic basis of dwarfing warrants continued investigation for additional sources of dwarfing.
In 2015, Washington State University (WSU, USA) pear rootstock breeding program was initiated to address the long-term industry need for dwarfing and precocious Pyrus rootstocks that are suited for the Pacific Northwest, the primary region of US pear production[12]. Rootstock seedling populations were generated for future selection of dwarfing candidates. Each seedling was budded with an identical scion variety to allow standardized comparison of dwarfing effect from the rootstock.
In this study, rootstock seedling populations from P. communis 'OH×F 333' and the interspecific hybrid 'H4' (P. spinosa × P. elaeagrifolia) were used due to their phenotypic segregation for vigor. 'OH×F 333' is a semi-dwarfing rootstock[5] that came from the 'Old Home' by 'Farmingdale' series that was originally developed to combine fire blight resistance and desirable horticultural traits[13]. Recent genotypic data elucidated the correct parentage of 'OH×F 333' as 'Old Home' by 'Bartlett'[14]. 'H4' was selected based on its compact stature and fertility (personal communication, Evans), but no prior experimental data were available.
The objectives of this study were to: (1) elucidate phenotypic relationships of dwarfing traits; (2) identify QTL associated with dwarfing; and (3) quantify haplotype effects of dwarfing QTL.
-
Seeds from reciprocal crosses between P. communis 'OH×F 333' and the interspecific hybrid 'H4' (P. spinosa × P. elaeagrifolia) were vernalized and germinated in 2017, resulting in 145 full-sib rootstock seedlings. Seedlings were maintained in the greenhouse until April 2018 when they were transplanted to the WSU Columbia View research orchard (47°33' N, 120°14' W) in Orondo, WA, USA. Seedling leaf tissue was collected for DNA extraction. The rootstock seedlings were chip budded with P. communis Beurré d'Anjou in August 2018. The following spring, each rootstock seedling tree was cut back to the bud, allowing the budded scion to become the new central leader. Growth effects of budbreak differences in the establishment year were minimized by cutting back each scion to 40 cm above the bud union in February 2020. Trees with less than 40 cm of scion growth were tipped.
Trees were planted with in-row spacing of 45 cm, between-row spacing of 2.5 m, and a triple wire trellis support. Trees were clipped to the wires with minimal further pruning within the timeframe of this phenotyping work. A standard irrigation and pesticide program was applied.
Phenotyping of vigor characteristics
-
Trees were phenotyped for various vigor/architectural traits in late fall 2020 (year 1) and 2021 (year 2). Phenotypic traits were: tree height (Height_202x – measured from ground level to the top of the tree); central leader annual growth (CL_AG_202x – annual growth of the central leader); total scion annual growth (TS_AG_202x – total annual growth of the scion, including the central leader); rootstock trunk cross-sectional area at 10 cm below the graft union (TCA_R10_202x); and scion trunk cross-sectional area at 20 cm above the graft union (TCA_S20_202x). For each TCA, trunk diameter was averaged between two measurements (rotated by 90°), and calculated with the following formula (assumption: trunk circumference is circular):
$ TCA=\pi {\left(\frac{{d}_{perpendicular}+{d}_{parallel}}{4}\right)}^{2} ; d\;{\rm is\; trunk\; diameter} $ Genotyping and genetic mapping
-
Young, newly expanded leaf tissues were collected from both parents and offspring of the reciprocal crosses. Genomic DNA was extracted with the DNeasy Plant Mini Kit (Qiagen Inc., Netherlands) using the manufacturer's extraction protocols. Extracted DNA was quantified using the NanoDrop™ 2000c spectrophotometer (Thermo Fisher Scientific Inc., Waltham, MA, USA) and qualified with 3.0% agarose gel electrophoresis. DNA concentration for each sample was adjusted to 15–50 ng/μL and submitted to Thermo Fisher Scientific Inc. for genotyping with the Applied Biosystems Axiom Pear 70 K Genotyping Array[15].
Raw data files (.CEL) were imported into Axiom Analysis Suite (v5.1.1; Thermo Fisher Scientific Inc.) to extract genotypic data in AA/AB/BB format. In summary, 'Axiom_PearAX58.c1' was selected for array type, 'best practices' for workflow, 'diploid.legacy.v5 (default)' as threshold configurations, as well as 'default' analysis configurations. Under the threshold settings, sample quality control (QC) parameters were as follows: dish QC ≥ 0.82, QC call rate ≥ 97%, and average call rate for passing samples ≥ 98.5%. Subsequent processing of genotypic data was carried out in R programming and Microsoft Excel.
Using the pseudo-testcross mapping strategy[16], two types of allelic segregation markers (i.e., <lm×ll> and <nn×np>) were chosen to construct two parental maps. Markers with missing SNP information in the offspring were discarded. Genotypes were then converted from AA/AB/BB format to the corresponding allelic segregation format of either lm/ll or nn/np, accounting for reciprocal crosses. Maternal/paternal effects were not investigated in this study.
Formatted data were imported into JoinMap v5.0 (Kyazma®, Netherlands)[17] where they were processed using 'CP (cross pollination)' population type with parameters to exclude markers of 100% similarity. Within each linkage group, markers were selected based on a minimum threshold logarithm of odds (LOD) score of 10.0, and were subsequently ordered based on their corresponding physical positions. Genetic distance was calculated using regression mapping with the Haldane's mapping function and default parameters.
QTL analysis and variance estimation
-
Genotypic outputs from JoinMap were converted to a four-way cross format for R/qtl v1.50[18] analysis. QTL detection was conducted using standard interval mapping with the EM algorithm. The minimum LOD score for QTL detection was determined by genome-wide LOD significance thresholds (α = 0.05) calculated using 1,000 permutations.
When a significant QTL (i.e., LOD exceeding genome-wide LOD threshold) was detected, the locus was specified with 'makeqtl' function, and QTL variance/effect was estimated with 'fitqtl' function. In our analysis, two QTLs were detected, and their effects were estimated individually. In addition, models accounting for additive (i.e., y ~ Q1 + Q2) and interaction (i.e., y ~ Q1 × Q2) effects were computed, where Q denotes a QTL and Q1 × Q2 is equivalent to Q1 + Q2 + Q1 : Q2.
Haploblock characterization
-
Haploblocks were characterized for significant QTLs. Haploblocks (i.e., a series of alleles at a genomic region with no recombination among the selected material) were constructed with overlapping QTL regions of vigor traits that exceeded 1.5-LOD support. Subsequently, one-way analysis of variance (ANOVA) was calculated to determine if each phenotypic trait was statistically different for presence versus absence of a given haplotype, where a value below ANOVA p < 0.05 was denoted as a significant-effect haplotype. To examine the effects of combinatory haplotypes (i.e., two loci), ANOVA (p < 0.05) of each haplotype combination was calculated for each phenotypic trait. Where statistical difference was detected, a Tukey's Honest Significant Difference (HSD) test (p < 0.05) was carried out to examine the average effects of each haplotype combination.
-
A wide range of vigor measurements was observed for each trait (Fig. 1). Phenotypic distributions were consistent across years. In general, our data showed three types of distributions: bimodal (e.g., tree height), right-skewed (e.g., total scion annual growth), and right-skewed multimodal (e.g., TCA). Bimodal/multimodal distributions of these vigor traits indicate that vigor is likely controlled by two or more genes.

Figure 1.
Histograms of architectural/vigor traits collected in 2020 and 2021. TCA: trunk cross-sectional area.
Strong positive correlations were found across most vigor traits (Fig. 2). Pearson's correlations of the same trait between years are high, indicating phenotypic consistency. For instance, TCA_R10 of 2020 and 2021 are strongly positively correlated at r = 0.90. Central leader annual growth 2020 has a perfect correlation of r = 1 with 2020 tree height. Of the total 45 pairwise correlations, 35 (78%) have correlation coefficient of over 0.70. Central leader annual growth 2021 is the one trait that is only moderately correlated with other traits (0.41 ≤ r ≤ 0.74). The lowest correlation coefficient (r = 0.41) is between central leader annual growth 2021 and total scion annual growth of 2020.
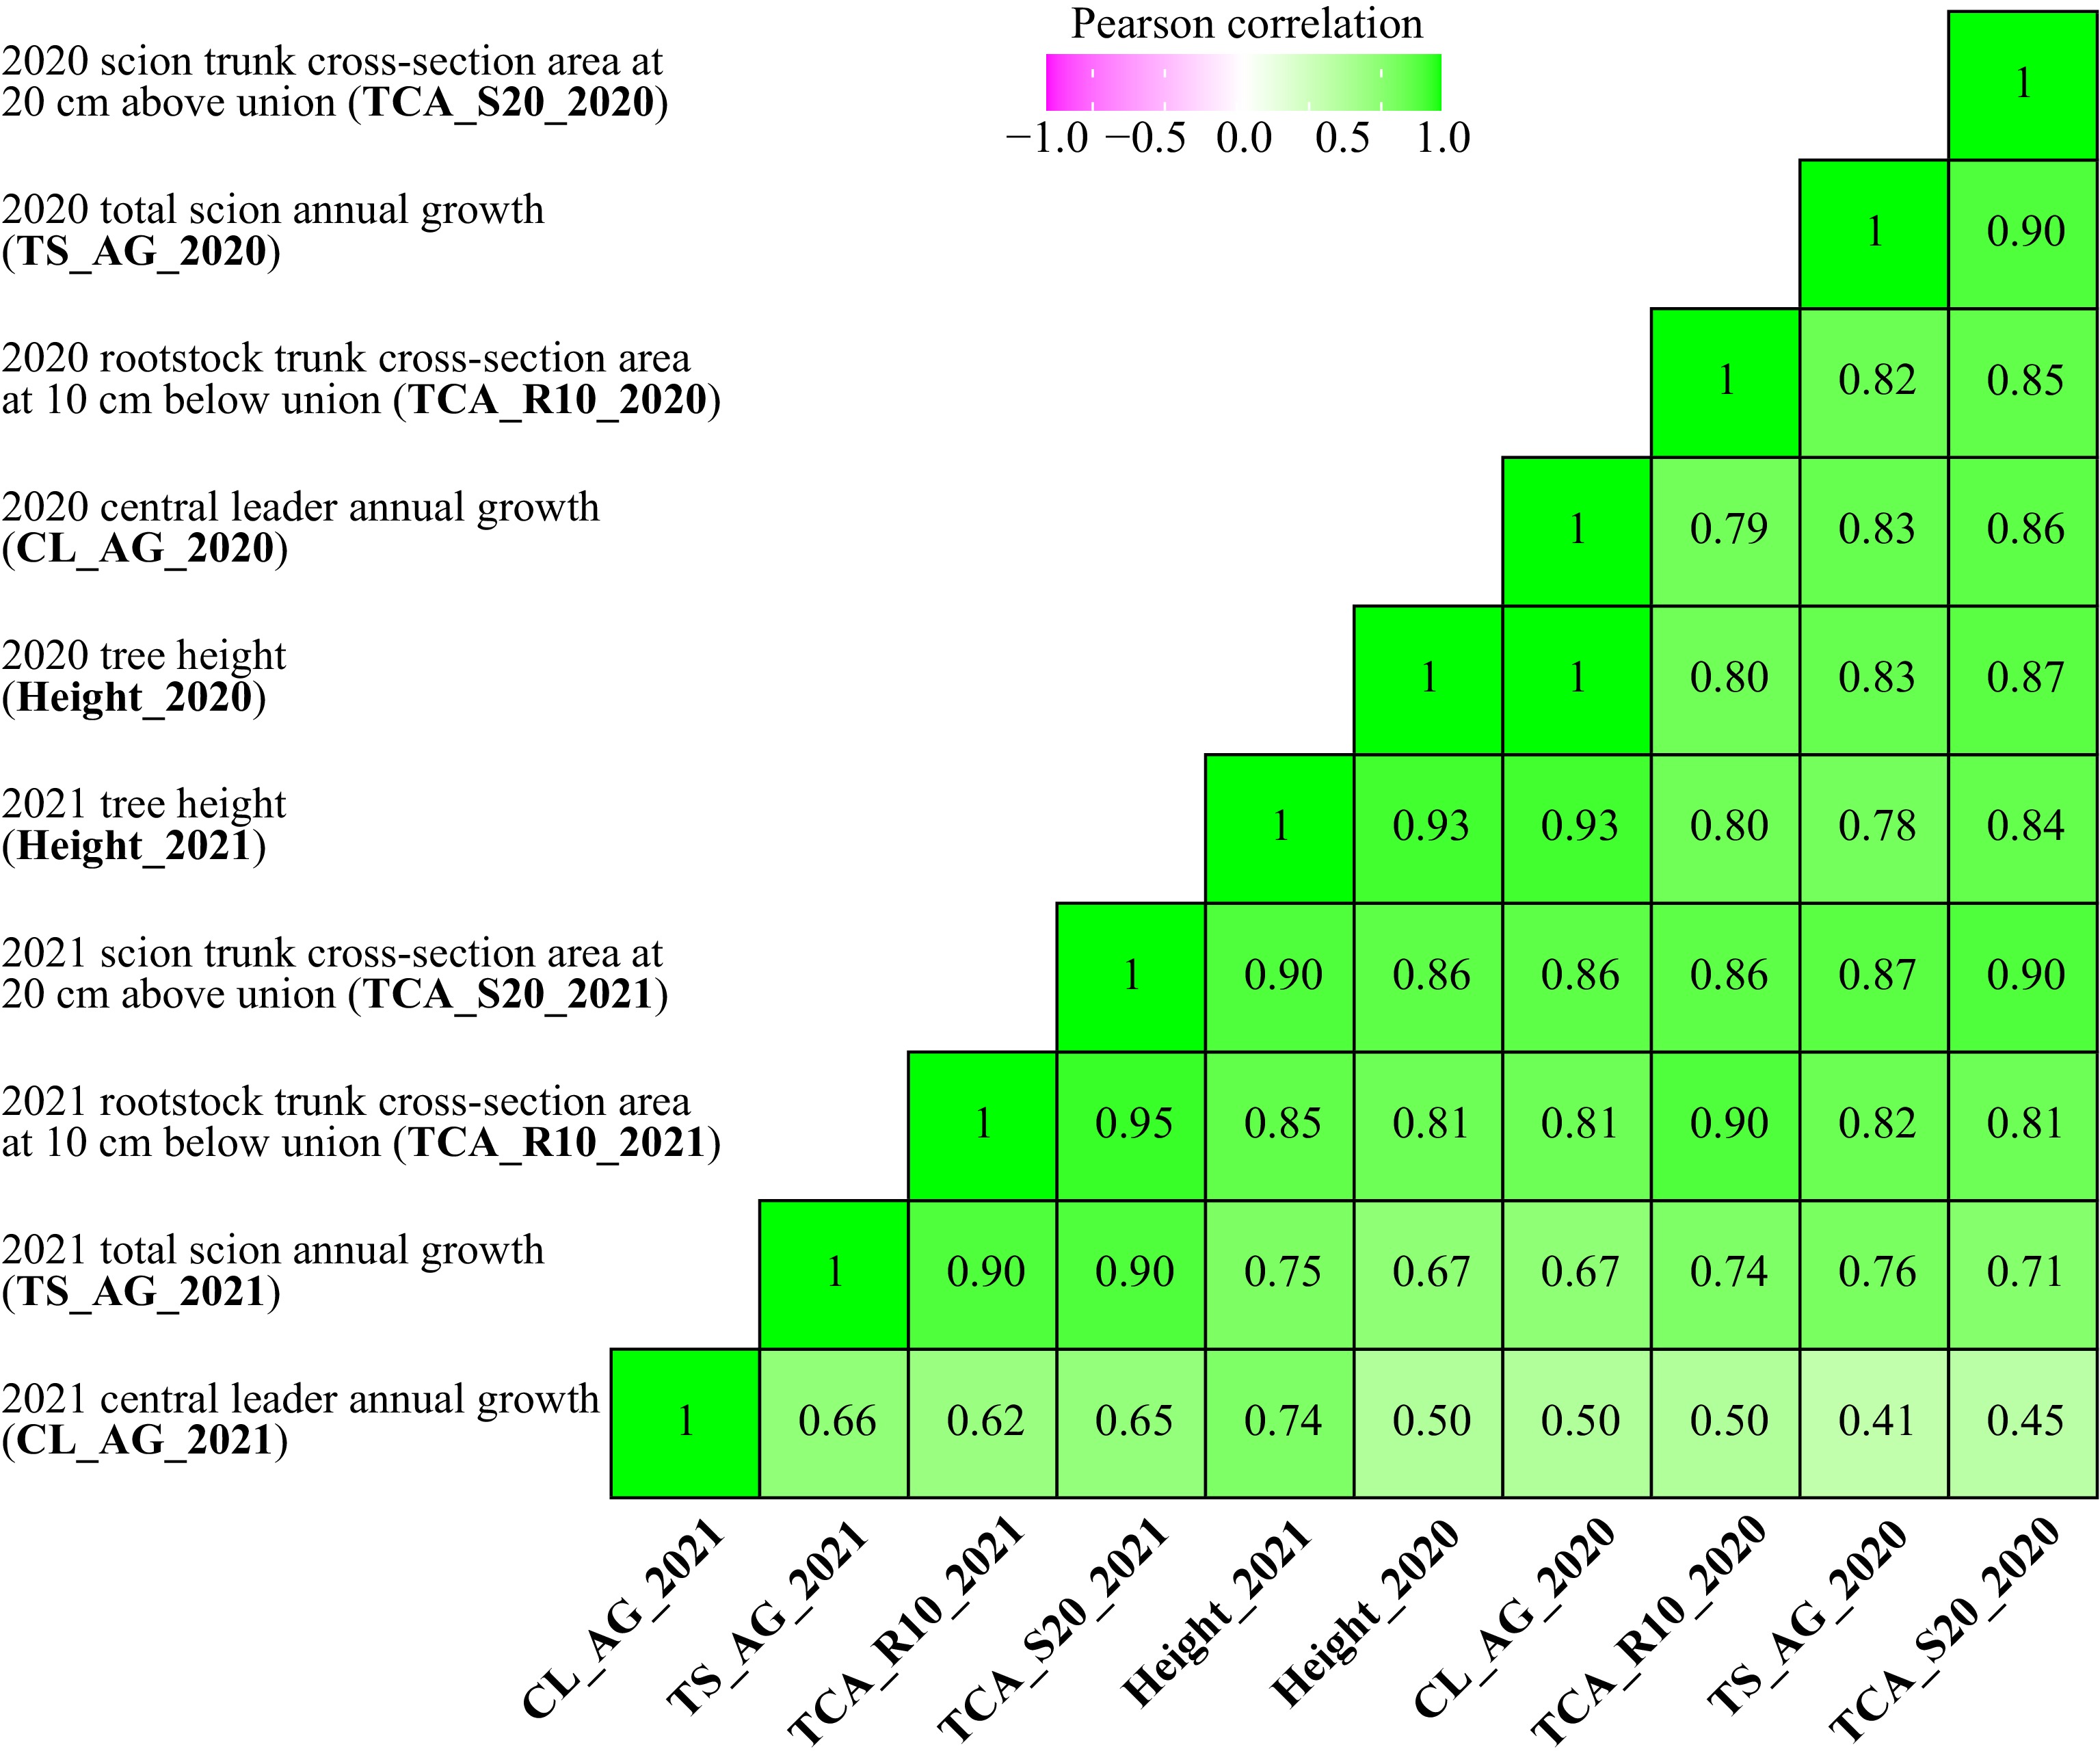
Figure 2.
Pearson’s correlations of 2020 and 2021 architectural/vigor traits. All coefficients are at significance levels of p < 1 × 10⁻⁴.
Genetic maps
-
High-resolution genetic maps were constructed using 1,897 and 1,597 markers for 'H4' and 'OH×F 333' maps with average densities of 1.31 and 1.36 marker/cM, respectively (Supplemental Fig. S1; Supplemental Table S1). The longest mapped chromosome was chromosome 15 on both maps, which in the 'OH×F 333' map was due to two sizeable gaps of 14.27 and 25.54 cM. Both maps exhibited overall marker collinearity between genetic and physical positions (Supplemental Fig. S2).
QTL detection
-
QTLs associated with vigor were detected on 'H4' but not on the 'OH×F 333' map. On the 'H4' map, significant QTLs (i.e., trait LODs exceeding genome-wide LOD thresholds) were mapped on chromosomes 5 and 15 (Fig. 3). On chromosome 5, QTLs associated with tree height, total scion annual growth, central leader annual growth, TCA_R10, and TCA_S20 were detected in the same region of 79–86 cM for two consecutive years. Each locus explained 10.2%–20.8% of phenotypic variance (Table 1). The top three loci explaining most phenotypic variance, in descending order, were Height_2021, TCA_R10_2021, and TCA_S20_2021.

Figure 3.
Detection of quantitative trait loci associated with architectural/vigor traits on (a) chromosome 5, and (b) chromosome 15 of 'H4'. Solid-filled horizontal bars denote quantitative trait loci detected at 1.5-logarithm of odds (LOD) support. Genetic positions of haploblocks on chromosomes 5 and 15 are highlighted in magenta. TCA: trunk cross-sectional area.
Table 1. QTL results (on 'H4' map) for vigor traits phenotyped in two years.
Trait LODGW Ch. Highest LOD
markerPosition
(cM)LOD PVE (%) Ch. Highest LOD
markerPosition
(cM)LOD PVE (%) Height_2020 3.2 5 AX-172375939 84.7 7.4 16.4 15 AX-171863784 4.2 5.6 11.5 Height_2021 3.1 5 AX-172375939 84.7 9.8 20.8 15 AX-171863784 4.2 8.2 16.9 CL_AG_2020 3.1 5 AX-172375939 84.7 7.3 16.5 15 AX-171863784 4.2 5.9 12.5 CL_AG_2021 3.0 5 AX-172375939 84.7 7.5 15.9 15 AX-171863784 4.2 7.5 17.4 TS_AG_2020 2.9 5 AX-172375939 84.7 3.9 10.2 15 AX-171863784 4.2 3.6 8.6 TS_AG_2021 2.8 5 AX-172375939 84.7 6.7 15.8 15 AX-171863784 4.2 5.0 10.6 TCA_R10_2020 3.0 5 AX-172375939 84.7 4.6 11.0 15 AX-171982210 19.5 6.3 18.0 TCA_R10_2021 3.1 5 AX-172375939 84.7 8.5 20.6 15 AX-171982210 19.5 7.6 19.6 TCA_S20_2020 3.1 5 AX-172375939 84.7 4.7 11.7 15 AX-171863784 4.2 3.5 7.6 TCA_S20_2021 3.1 5 AX-172375939 84.7 7.9 17.4 15 AX-171863784 4.2 6.7 13.9 LODGW: Genome-wide logarithm of odds significance threshold (α = 0.05); Ch.: chromosome; LOD: logarithm of odds; PVE: phenotypic variance explained; Height: tree height; CL_AG: central leader annual growth; TS_AG: total scion annual growth; TCA_R10: rootstock trunk cross-sectional area at 10 cm below union; TCA_S20: scion trunk-sectional area at 20 cm above union. On chromosome 15, trait loci for both years were detected (Fig. 3). Unlike chromosome 5 QTLs that all mapped to the same region, there were two genomic regions for chromosome 15 QTLs. Loci associated with tree height and central leader annual growth were detected at 2–11 cM, while loci associated with TCA_R10 were at 16–23 cM. Total scion annual growth QTLs in both years spanned a broader region from 0 to 27 cM. Each locus explained 7.6%–19.6% of phenotypic variance (Table 1). The top three loci explaining most phenotypic variance, in descending order, were TCA_R10_2021, TCA_R10_2020, and CL_AG_2021.
Two models were used to estimate combined phenotypic variance explained by two loci (Table 2). The first was an additive model (y ~ Q1 + Q2), which did not account for interaction effects. Loci on chromosome 5 explained 10.2%–20.8% of variance, while loci on chromosome 15 explained 7.6%–19.6%. Using a pure additive model, both loci combined to account for approximately 30% of phenotypic variance. Another model (y ~ Q1 + Q2 + Q1 : Q2) accounted for interaction effects which are likely more applicable in our study. In this model, estimation of individual locus effect was higher (i.e., 19.1%–30.7% for chromosome 5 QTLs; 16.2%–29.6% for chromosome 15 QTLs). Factoring in interaction effects, total explained variances for both loci ranged between 32.6% and 57.7%.
Table 2. QTL effects estimated with two models on 'H4' chromosome 5 and 15 haplotypes.
Trait Model: y ~ Q1 + Q2 Model: y ~ Q1 + Q2 + Q1 : Q2 QTLch5 (%) QTLch15 (%) Total (%) QTLch5 (%) QTLch15 (%) Interaction (%) Total (%) Height_2020 16.4 11.5 27.9 25.8 20.8 9.3 44.2 Height_2021 20.8 16.9 37.6 30.6 26.7 9.8 56.8 CL_AG_2020 16.5 12.5 28.9 26.4 22.3 9.9 46.0 CL_AG_2021 15.9 17.4 33.2 23.4 24.9 7.5 49.1 TS_AG_2020 10.2 8.6 18.8 20.8 19.2 10.6 33.7 TS_AG_2021 15.8 10.6 26.4 26.9 21.7 11.1 44.0 TCA_R10_2020 11.0 18.0 28.9 19.1 26.1 8.1 43.0 TCA_R10_2021 20.6 19.6 40.2 30.7 29.6 10.1 57.7 TCA_S20_2020 11.7 7.6 19.3 20.2 16.2 8.5 32.6 TCA_S20_2021 17.4 13.9 31.3 26.3 22.8 8.9 48.0 y: variance/effects; Q: quantitative trait locus (QTL); ch: chromosome; Height: tree height; CL_AG: central leader annual growth; TS_AG: total scion annual growth; TCA_R10: rootstock trunk cross-sectional area at 10 cm below union; TCA_S20: scion trunk-sectional area at 20 cm above union. Analysis of vigor haplotypes
-
Haploblocks associated with vigor traits were constructed for chromosome 5 and 15 QTLs (Supplemental Tables S2, S3 & S4). The haploblock on chromosome 5 is comprised of 28 SNP markers spanning 18.1 cM (genetic distance; 72.1–90.2 cM) or 7.9 Mbps (physical distance; 19.5–27.4 Mbps). Two distinct haplotypes, 5A (dwarfing) and 5B (vigorous), segregated at a 1:1 ratio of 63 and 62 seedlings, respectively (Supplemental Table S2). Based on one-way ANOVA, these haplotypes were statistically significant (5 × 10⁻¹⁰ < p < 5 × 10⁻⁵) across all traits (Table 3; Fig. 4).
Table 3. One-way analysis of variance (ANOVA) for dwarfing versus vigorous haplotype on chromosomes 5 and 15 of 'H4'.
Trait Chromosome 5 haplotype from 'H4' p Chromosome 15 haplotype from 'H4' p Dwarfing (n) Vigorous (n) Dwarfing (n) Vigorous (n) Height_2020 5A 63 5B 62 9.5E-08 15_1A 57 15_1B 78 8.0E-06 Height_2021 5A 63 5B 62 4.8E-10 15_1A 57 15_1B 78 2.1E-08 CL_AG_2020 5A 63 5B 62 1.1E-07 15_1A 57 15_1B 78 5.1E-06 CL_AG_2021 5A 63 5B 62 7.5E-08 15_1A 57 15_1B 78 9.4E-09 TS_AG_2020 5A 63 5B 62 4.8E-05 15_1A 57 15_1B 78 2.8E-04 TS_AG_2021 5A 63 5B 62 9.7E-08 15_1A 57 15_1B 78 6.0E-06 TCA_R10_2020 5A 63 5B 62 4.1E-05 15_2A 62 15_2B 76 8.3E-08 TCA_R10_2021 5A 63 5B 62 6.5E-09 15_2A 62 15_2B 76 1.3E-08 TCA_S20_2020 5A 63 5B 62 1.0E-05 15_1A 57 15_1B 78 6.7E-04 TCA_S20_2021 5A 63 5B 62 1.1E-08 15_1A 57 15_1B 78 6.2E-07 n: number of seedlings with the haplotype; Height: tree height; CL_AG: central leader annual growth; TS_AG: total scion annual growth; TCA_R10: rootstock trunk cross-sectional area at 10 cm below union; TCA_S20: scion trunk-sectional area at 20 cm above union. 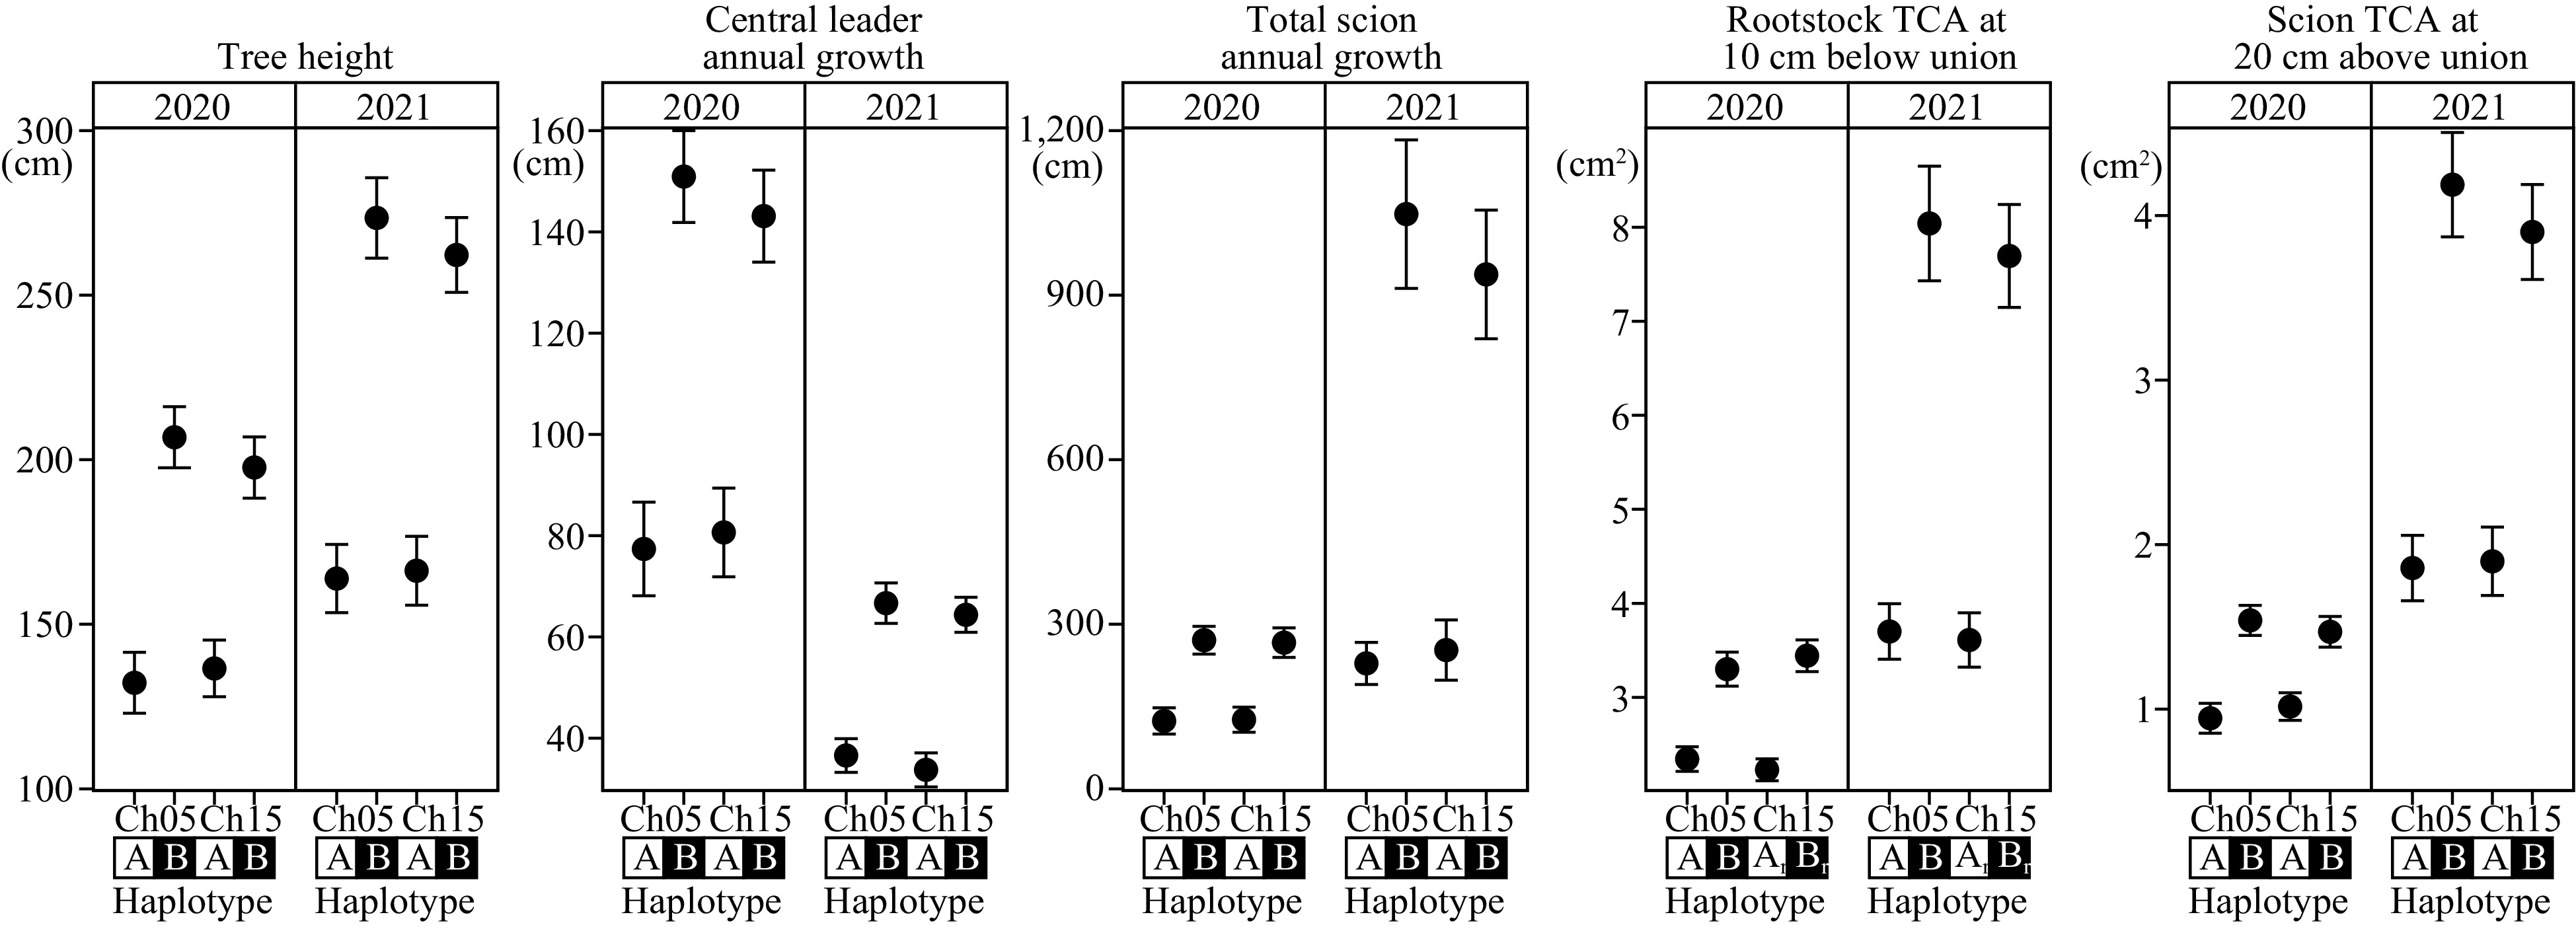
Figure 4.
Haplotype effects of architectural/vigor traits on chromosome 5 and 15 loci. All within-chromosome haplotypes were statistically significant at p ≤ 1 × 10⁻³. Dwarfing and vigorous haplotypes were denoted as A and B, respectively. Ch: chromosome; TCA: trunk cross-sectional area; 1r: chromosome 15 rootstock haploblock; 2r: chromosome 15 rootstock haploblock.
Two haploblocks are associated with chromosome 15 loci. The first haploblock is strongly associated with rootstock-conferred traits, but less strongly with rootstock TCA. This haploblock is comprised of 13 SNPs spanning 10.4 cM (genetic; 0.0–10.4 cM) or 4.2 Mbps (physical; 1.0–5.2 Mbps). Two haplotypes, 15_1A (dwarfing) and 15_1B (vigorous) segregated at a near 1:1 ratio (57:78 seedlings) and were statistically different (9 × 10⁻⁹ < p < 7 × 10⁻⁴) across rootstock-conferred traits (Fig. 4; Table 3; Supplemental Table S3).
The second haploblock, located 6 cM downstream, is highly linked with rootstock TCA, but less strongly with rootstock-conferred traits. This haploblock is comprised of 11 SNPs spanning 7.0 cM (genetic; 16.7–23.7 cM) or 1.8 Mbps (physical; 6.2–8.0 Mbps). Two haplotypes, 15_2A (dwarfing) and 15_2B (vigorous), segregated at a near 1:1 ratio (62:76 seedlings) and were statistically different (1 × 10⁻⁸ < p < 8 × 10⁻⁸) in both years of rootstock TCA (Fig. 4; Table 3; Supplemental Table S4). Only eight individuals have a recombination between the two haploblock regions on chromosome 15. Fifty-eight individuals carry dwarfing haplotypes in both regions, while 73 individuals carry vigorous haplotypes in both regions.
Haplotype combination was also analyzed to estimate the effects of both loci on chromosomes 5 and 15. Seedlings with two copies of dwarfing haplotypes exhibited the lowest phenotypic means across all vigor traits (Fig. 5). In contrast, seedlings with two copies of vigorous haplotypes showed the highest phenotypic means, and were statistically different from those with at least one copy of dwarfing haplotype (Tukey's HSD: p < 0.05 across all vigor traits). In general, no statistical difference was detected among offspring with at least one copy of dwarfing haplotype (i.e., 5A/15B, 5B/15A, 5A/15A; where A – dwarfing, B – vigorous haplotype), except for CL_AG_2021 (p = 0.014) where 5A/15B was statistically different from 5A/15A.
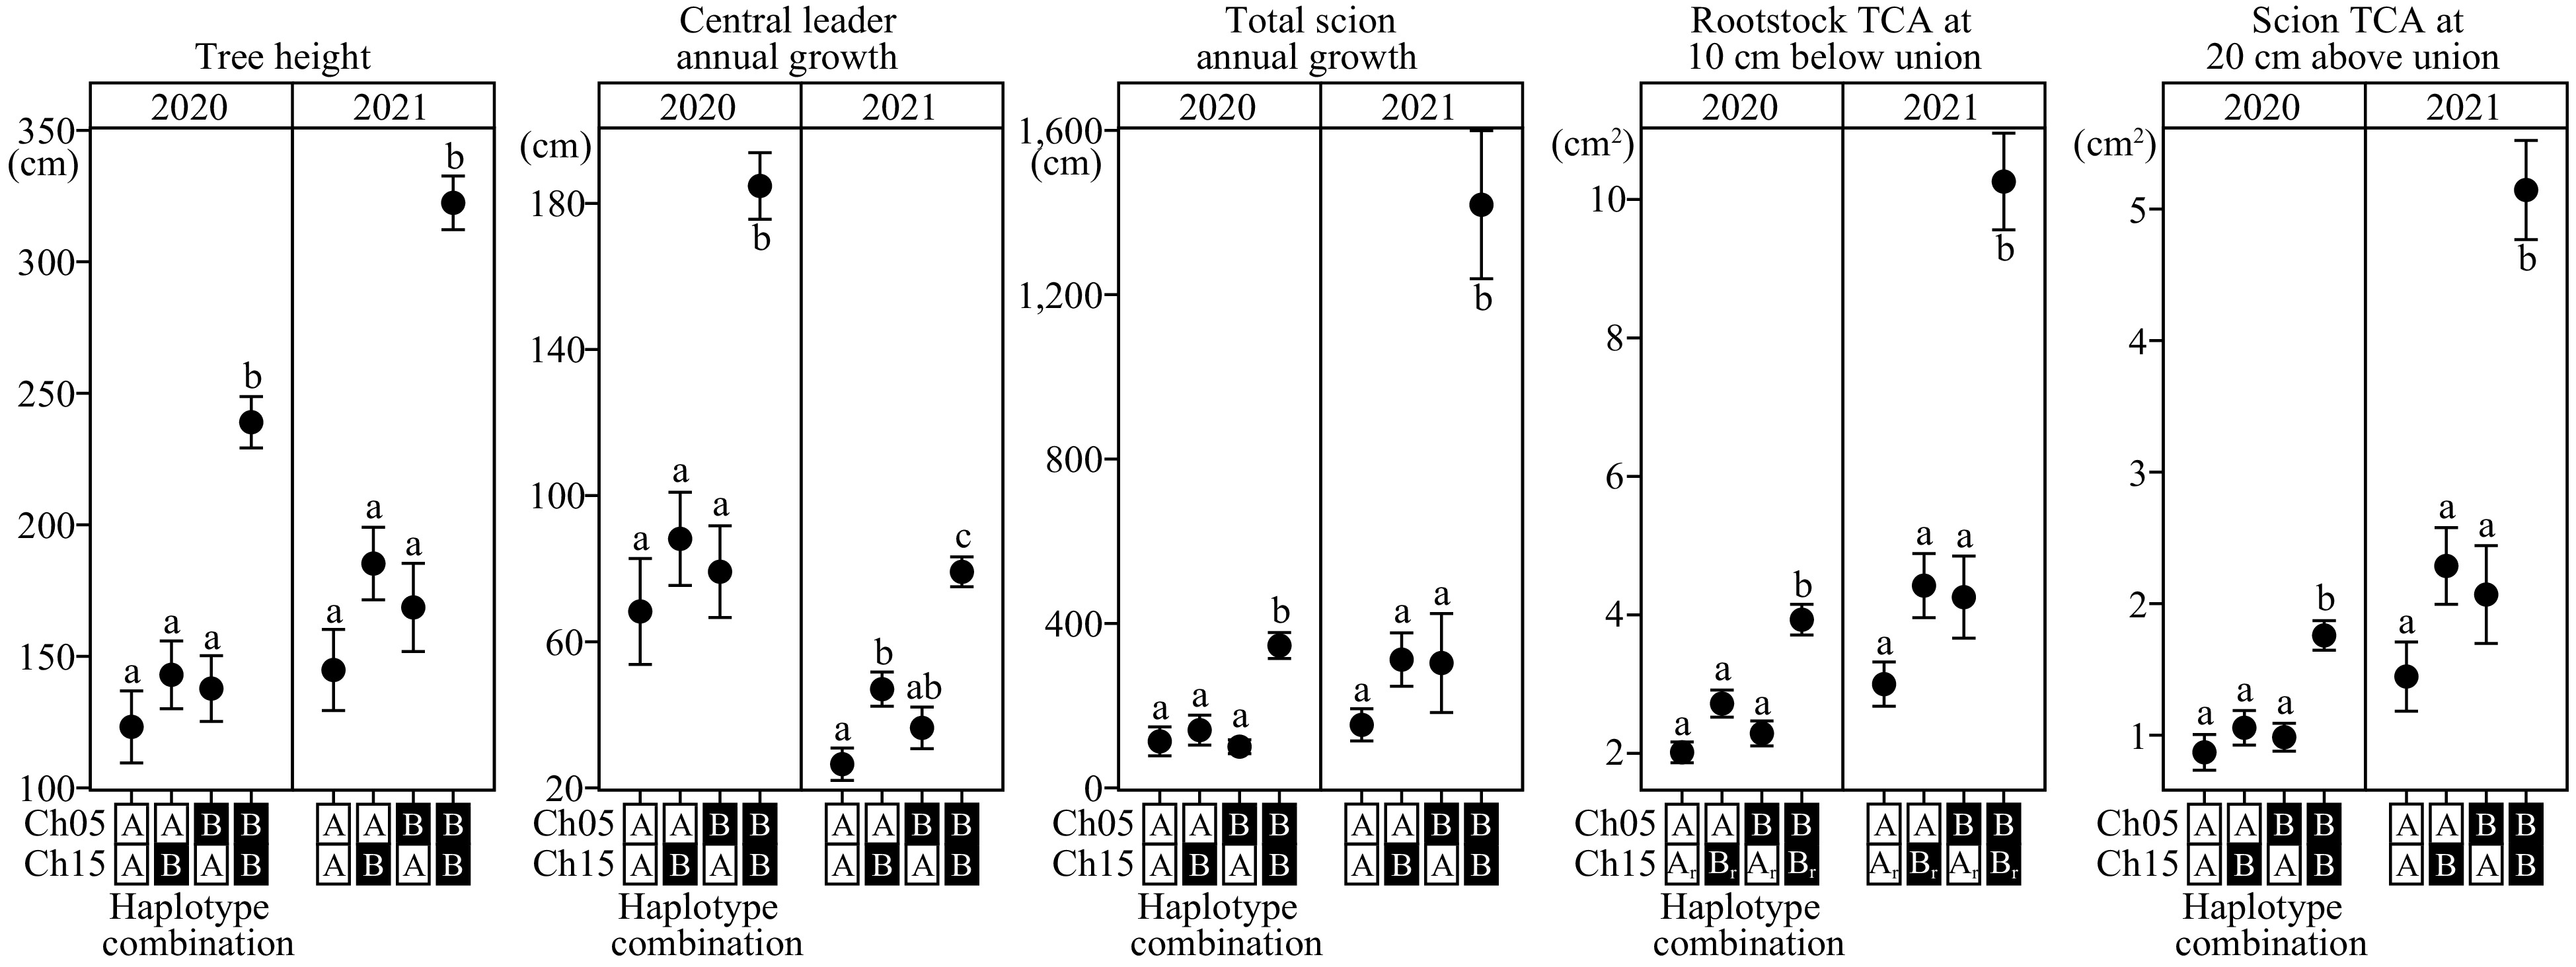
Figure 5.
Combined haplotype effects of architectural/vigor traits on chromosome 5 and 15 loci. Different mean separation letters were determined using Tukey’s Honest Significant Difference (p < 0.05). Dwarfing and vigorous haplotypes were denoted as A and B, respectively. The numbers of individuals for each haplotype combination, from left to right, are: 36, 33, 22, and 45. For rootstock TCA plot, the numbers of individuals for each haplotype combination, from left to right, are: 37, 32, 24, and 44. Ch: chromosome; TCA: trunk cross-sectional area; 1r: chromosome 15 rootstock haploblock; 2r: chromosome 15 rootstock haploblock.
-
Studying the genetic basis of tree architecture and rootstock-conferred traits is highly complex. The need for a standard scion variety, laborious quantitative phenotyping, and long-term resource requirements to generate and maintain segregating populations are foundational to a systematic genetic dissection of dwarfing, which is lacking in pear. To the best of our knowledge, this is only the second report of QTLs associated with Pyrus dwarfing, and the first in characterizing haplotype effects of the associated QTLs, which may facilitate future marker development for DNA-informed breeding.
Quantitative variation and correlation of vigor traits
-
Large variation was observed across all vigor traits (Fig. 1), indicating the quantitative nature of vigor/dwarfing. Trait distributions were generally bimodal or multimodal and consistent between years, suggesting that the trait was controlled by at least two genes. While seedlings were phenotyped for scion vigor, rootstock vigor, and overall tree architecture, these traits were all highly correlated with one another, with over 75% of correlation coefficients above 0.70 (Fig. 2). Knäbel et al.[11] reported moderate correlation coefficients between most vigor traits (0.40 ≤ r ≤ 0.70) or low coefficients when correlating data from year 1 or 2 with year 3 or 4. Similar to Knäbel et al.[11], TCA is a reliable indicator of vigor, as it is highly correlated with architectural traits (Fig. 2) and other vegetative growth traits (data not shown).
Parental map limitations
-
Use of a high quality 70 K SNP array[15] facilitated the construction of high-resolution genetic maps. While overall marker collinearity between genetic and physical positions were observed (Supplemental Fig. S2), three chromosomes on 'OH×F 333' map had sizeable gaps (Supplemental Fig. S1). In particular, there are two large gaps on the top half of 'OH×F 333' chromosome 15, which could be due to structural variations, presence of sex/lethality alleles, or lack of informative markers. Chromosome 15 of genetic maps by Knäbel et al.[11] and Montanari et al.[19] also contained sizeable gaps and were comparatively longer than other chromosomes, although it is worth noting that these studies predated the availability of the 70 K SNP array. Zurn et al.[20] reported genetic marker positions for three pear populations, one of which (i.e., 'Potomac' × 'El Dorado') when mapped, had similar gaps to our 'OH×F 333' map.
Dwarfing QTLs on chromosomes 5 and 15
-
In this study, we identified dwarfing QTLs on chromosomes 5 and 15 of the 'H4' map. Two consecutive years of loci detection in the same genomic regions indicated QTL robustness and stability (Fig. 3). In general, the loci effects of chromosome 5 (10.2%–20.8%) were stronger than those of chromosome 15 (7.6%–19.6%; Table 1). While the same loci were detected in two years, loci associated with 2021 phenotypic traits were more pronounced (Fig. 3). This also translated to higher explained phenotypic variances among 2021 traits than 2020 traits, with the exception of CL_AG, which was marginally higher in 2020 (Table 1).
Inclusion of rootstock traits (e.g., TCA_R10_202x) or overall tree architecture (e.g., tree height) still resulted in identical QTL detection, as previously reported in apple[7] and pear[11] dwarfing QTL studies. In this study, the same chromosome 5 QTL was detected for TCA_R10_202x and tree height (Fig. 3); however, a different finding was observed in chromosome 15 QTL mapping. While tree height QTL was identical with rootstock-conferred QTL, TCA_R10_202x was mapped approximately 15 cM downstream of the common QTL region. Interestingly, total scion annual growth (i.e., TS_AG_202x) was mapped to a broader region spanning both loci. To our best knowledge, there was no previous report of a dwarfing locus on chromosome 15. The chromosome 15 QTL findings of this study showed two putative dwarfing loci, located in close proximity, that explained up to 20% variance. However, it remains unclear if these are two closely linked QTLs, or one QTL; additional resources (e.g., fine mapping, low-coverage genome sequencing) will be required to resolve this.
Is the chromosome 5 dwarfing QTL novel?
-
With a previous report of a dwarfing QTL on chromosome 5[11], it is of interest to determine whether the 'H4' dwarfing QTL is novel or co-localizes with their QTL. The chromosome 5 QTL was detected for number of branches, inflorescence, growth length of new main axis, number of spurs, tree height, rootstock TCA, trunk TCA, and TCA main axis growth[11]. Differences in SNP genotyping technologies, marker naming convention, and lack of common markers complicated comparisons. Knäbel et al.[11] utilized the apple and pear Infinium® II IRSC 9 K SNP array[19,21], and physical positions of dwarfing associated markers, designated in 'ss___' format, were not readily available. Markers were aligned to the maps of Montanari et al.[19], which were previously anchored to the 'Bartlett' v1.0 map[22]. Of the six unique dwarfing markers on chromosome 5 reported by Knäbel et al.[11], only two (i.e., ss527789077 and ss527788221) were found with reported physical positions (i.e., 64 kbps and 525 kbps, respectively) on the 'Bartlett' v1.0 map. When aligning our most LOD-significant marker (i.e., AX-172375939; Table 1) to the 'Bartlett' v1.0 map for direct comparison, our marker was located at 76 kbps physical position. While an improved assembly of doubled haploid 'Bartlett' (referred to as BartlettDHv2.0) is available[23], different marker naming conventions hampered our search efforts.
Only some of the 'ss___' markers have searchable corresponding 'AX-___' designations that can be queried against the 70 K SNP array. Using chromosome 5 dwarfing associated markers from Knäbel et al.[11], only three markers matched the query, appearing in the physical window between 30.0 Mbps and 31.1 Mbps, which is different from our reported QTL physical window of 19.5 to 27.4 Mbps (Supplemental Table S2). Additionally, the chromosome 5 QTL by Knäbel et al.[11] originated from P. communis 'Old Home', while our QTL originated from interspecific backgrounds, and coincidentally, no QTL was detected in the 'OH×F 333' map, of which 'Old Home' was a progenitor.
Based on current resources and preliminary analysis, the 'H4' chromosome 5 QTL is most likely a novel dwarfing locus. This QTL could also be orthologous to Malus Dw1 (identified on chromosome 5), similar to the syntenic relationship proposed for the 'Old Home' chromosome 5 dwarfing locus by Knabel et al.[11]. Recent whole-genome duplication that occurred prior to pear and apple divergence suggested the presence of similar genes in both Pyrus and Malus[24].
The chromosome 15 QTL is likely not orthologous to any Malus dwarfing loci. The top and bottom ends of Pyrus chromosome 15 are homologous to the corresponding regions of Malus[24]. Malus Dw1[6], Dw2[7], and Dw3/Rb3[9] were mapped on chromosomes 5, 11, and 13, respectively, none of which are homologous to chromosome 15 of Pyrus[24].
Haplotype effects of chromosome 5 and 15 QTLs
-
Presence of dwarfing haplotype at each QTL showed significant reduction in vigor (Fig. 4). Depending on trait and year, vigor reduction at one locus was typically between 30% and 50%. In general, vigor reduction of chromosome 5 dwarfing haplotype was marginally stronger (though not statistically significant) than chromosome 15 dwarfing haplotype. Year-to-year variability of vigor reduction was significant, and was typically more pronounced in 2021. This was likely explained by the year-to-year phenotypic variability (Fig. 1).
As this is the first report of dwarfing haplotypes in Maloideae, no comparison with previous haplotype effects can be made. A haplotype-based approach is more informative and reliable than a single-marker approach (e.g., SNP) because a haploblock can have more than two haplotypes, whereas a tested SNP has at most two alleles, and any potentially unknown mutation may compromise the reliability of DNA test results[25].
Interactions between dwarfing QTLs/haplotypes are not purely additive
-
In this study, the most dwarfing seedlings are those that inherited both chromosome 5 and 15 dwarfing QTLs/haplotypes from the dwarfing parent, 'H4', which is heterozygous at each QTL. Analysis of combined haplotype effects indicated statistically significant vigor reduction with just one copy of dwarfing, compared to individuals without. In all traits across two years, there was no significant difference in vigor between one dwarfing haplotype of chromosome 5 versus chromosome 15. In almost all instances, the presence of an additional dwarfing haplotype (i.e., two dwarfing haplotypes) showed a further reduced vigor that was not significantly different. The presence of an additional dwarfing haplotype acted as an enhancer, with total vigor reduction of 50%−70%. The effects were not purely additive due to epistatic interactions. The exception was CL_AG_2021, where an additional dwarfing haplotype of chromosome 15 significantly reduced vigor; however, this difference was observed in 2021.
Chromosome 5 and 6 dwarfing QTLs were identified by Knäbel et al.[11], but there was no report of their combined QTL effects. Interestingly, the chromosome 5 QTL was also associated with precocity (i.e., reduced juvenility), while the chromosome 6 QTL was associated only with dwarfing. In our study, precocity and dwarfing are also highly correlated, but precocity QTL was not detected in either parental map (data not shown).
Given the lack of Pyrus dwarfing genetic analyses, our findings can only be compared to the closely related Malus dwarfing genetic studies. In the 'Ottawa 3' (Dw1/dw1; Dw2/dw2) × M. robusta 5 (dw1/dw1; dw2/dw2) progeny, vigor reduction of one dwarfing locus was independent of the other[7]. They reported similar trunk diameters between offspring with either Dw1 or Dw2. Offspring possessing both dwarfing loci exhibited dramatically reduced vigor, unlike our findings where vigor reduction was mostly achieved with just one dwarfing haplotype. In another segregating progeny, 'G.935' (Dw1/dw1; Dw2/dw2) × 'B.9' (Dw1/dw1; Dw2/dw2), the presence of homozygous non-dwarfing alleles at either Dw1 or Dw2 nullified the dwarfing effect at the other locus[7].
In a different QTL study using 'M.9' × M. robusta 5, Dw1 exhibited a stronger dwarfing effect than Dw2, and while Dw2 enhanced dwarfing, it alone cannot induce dwarfing[8]. This also contrasted with our findings, where either dwarfing locus can reduce vigor significantly. For clarity, Dw2 of Foster et al.[8] differed in position from Dw2 of Fazio et al.[7].
Study limitations
-
A limitation of this study was the use of single replicate seedlings, which was constrained in number by the prohibitively time-consuming nature of phenotyping. Environmental impacts on dwarfing were not captured, as these seedlings were planted at one orchard location. Rootstock-conferred vigor is most likely influenced by environmental conditions, such as climate, soil quality, and nutrient availability. However, we conducted a leaf nitrogen composition analysis of all seedlings to determine spatial variability of nitrogen in the orchard that may affect differential vigor expression (which would confound findings), and results showed uniform spatial variability of leaf nitrogen concentrations in the orchard (data not shown).
A critical challenge in characterizing vigor is the lack of standardization in phenotyping. Scion TCA is a common dwarfing metric, but there is no consistency in the literature as to a standard distance from the graft union (e.g., 10 cm, 15 cm, 20 cm) for measurements. In our work, we measured both TCA_S10_202x and TCA_S20_202x, but reported only the latter, as 10 cm trait data also yielded the same QTL and haplotype effect (data not shown). Overall tree architecture (e.g., tree height) and rootstock traits were also measured, as it is not well understood if these traits are comparable to rootstock-conferred dwarfing traits. Harrison et al.[9] described rootstock-conferred traits as secondary conferred traits, as they are 'manifestation of vigor control in the scion', and instead measured the proportion of root cross-sectional area that was occupied by root bark, termed root bark percentage.
Another limitation of this study was the use of only one scion variety, P. communis Beurré d'Anjou. Evaluating more scion varieties would add clarity and robustness to our understanding of scion-rootstock interactions and potential dwarfing mechanisms of size-controlling rootstocks. Finally, at this time of the analysis, fruit data are not available, so it remains to be seen whether the seedling candidates with dwarfing potential would also impact fruit quality of the scion (may be variety-specific). Desirable Pyrus rootstocks for commercial release should not only confer dwarfing and precocity, but also positively impact fruit quality, as well as being resistant/tolerant to regionally important diseases and pests. Despite identification of two dwarfing loci in 'H4', recent discovery of its fire blight susceptibility[26] should be taken into account when designing crosses.
Conclusions and breeding implications
-
The Pyrus rootstock seedlings in this work were generated for the sole purpose of identifying and selecting dwarfing candidates. Choice of breeding parents was based on anecdotal information, as prior genotypic knowledge on dwarfing was not available. Two years of systematically evaluating architectural traits of seedling trees revealed phenotypic segregation and distribution that paved the way for QTL mapping.
In summary, two novel loci with major size-controlling/vigor-reducing effects were detected on chromosomes 5 and 15. Single haplotype analysis showed vigor reduction at each locus averaging between 30% and 50%. Combined haplotype analysis revealed that one dwarfing locus was sufficient to significantly reduce vigor. Having an additional dwarfing haplotype further reduced vigor, totaling 50%−70%, but the combined reduction was not purely additive due to epistasis.
We propose the naming of these novel dwarfing chromosome 5 and 15 loci as P×Dwg1 and P×Dwg2, respectively. Note the use of 'multiplication' sign instead of letter 'x' (may imply xerophila), as both loci were derived from the interspecific P. hybrid 'H4'. Dwg denotes 'rootstock-conferred dwarfing', a clear distinction from the Dw in PcDw that refers to 'dwarf'. However, some confusion is inadvertently introduced, as Malus Dw1, Dw2, and Dw3 clearly refer to rootstock-conferred dwarfing.
This work decoded the dwarfing genotypes of the breeding parents, namely P. hybrid 'H4' (P×Dwg1/P×dwg1; P×Dwg2/P×dwg2) and P. communis 'OH×F 333' (P×dwg1/P×dwg1; P×dwg2/P×dwg2).
Discovering novel sources of dwarfing (i.e., P×Dwg1 and P×Dwg2) in the Pyrus genome is a major milestone to our limited understanding of this complex and important architectural trait. The haplotype information may guide rootstock breeders in crossing decisions. Development of KASP™ (Kompetitive Allele Specific PCR) markers for P×Dwg1 and P×Dwg2 haplotypes is currently underway to validate dwarfing effects on other rootstock seedlings in the breeding program. In addition, functional annotation of these haplotype regions is being conducted as a first step in identifying candidate genes.
The authors thank members of the pome fruit breeding program, and former/retired members (Caitlin Madden, Nancy Buchanan, Richard Volpe, Sarah Kostick, and Schaefer Buchanan) for their invaluable contributions in maintaining the seedling trees and/or collecting data. The WSU pear rootstock breeding program is funded by Fresh and Processed Pear Committee Research (PR-09-905, PR-15-105, PR-19-108, and PR-22-102), and USDA National Institute of Food and Agriculture Hatch project 1014919.
-
The authors declare that they have no conflict of interest.
- Supplemental Fig. S1 Genetic maps of (a) interspecific Pyrus hybrid 'H4', and (b) Pyrus communis 'OH×F 333'.
- Supplemental Fig. S2 Collinearity between physical and genetic positions of markers on (a) interspecific Pyrus hybrid 'H4' map, and (b) Pyrus communis 'OH×F 333' map.
- Supplemental Table S1 Number of SNP markers, chromosome lengths, and marker density of 'H4' and 'OH×F 333' genetic maps. Ch: chromosome.
- Supplemental Table S2 Twenty-eight SNP markers used for construction of chromosome 5 haploblock, and sequences associated with vigor phenotypes.
- Supplemental Table S3 Thirteen SNP markers used for construction of chromosome 15 haploblock region 0 to 10 cM, and sequences associated with rootstock-conferred scion phenotypes.
- Supplemental Table S4 Eleven SNP markers used for construction of chromosome 15 haploblock region 17 to 24 cM, and sequences associated with rootstock trunk cross-sectional area.
- Copyright: © 2023 by the author(s). Published by Maximum Academic Press, Fayetteville, GA. This article is an open access article distributed under Creative Commons Attribution License (CC BY 4.0), visit https://creativecommons.org/licenses/by/4.0/.
-
About this article
Cite this article
Teh SL, York Z, Evans K. 2023. Genetic mapping and haploblock characterization of two novel major dwarfing loci in reciprocal Pyrus rootstock seedling families. Fruit Research 3:20 doi: 10.48130/FruRes-2023-0020 

Genetic mapping and haploblock characterization of two novel major dwarfing loci in reciprocal Pyrus rootstock seedling families
- Received Date: 16 May 2023
- Accepted Date: 28 June 2023
- Published Online: 29 August 2023
Abstract: US pear production is constrained by the lack of dwarfing and precocious rootstocks that revolutionized other fruit crops, such as apple. While quince is used as a rootstock in global pear production, concerns about potential graft incompatibility and lack of cold hardiness limit its adoption in the US. This work was aimed at identifying genetic determinants of dwarfing in Pyrus backgrounds to inform future breeding for dwarfing Pyrus rootstocks. In 2018, 145 rootstock seedlings of two reciprocal crosses were budded with a standard scion variety. Rootstock seedlings were also genotyped with the 70 K Pyrus SNP array. Based on two-year orchard architectural phenotypes, quantitative trait loci (QTLs) were consistently mapped on both chromosomes 5 and 15 for dwarfing traits, namely scion trunk cross-sectional area (TCA), total scion annual growth, and central leader annual growth. QTLs for rootstock TCA were also detected on both chromosomes 5 and 15; however, the chromosome 15 QTL did not co-localize with the scion trait locus. Each dwarfing haplotype accounted for 30% to 50% reduction in vigor (p < 0.05). Combined haplotype analysis showed that one dwarfing locus was sufficient to significantly reduce vigor. Presence of two dwarfing haplotypes further reduced vigor by a total of 50% to 70% (p < 0.05), but their combinatory effects were not purely additive due to epistasis. Discovery of these novel dwarfing loci (named P×Dwg1 and P×Dwg2) in Pyrus facilitates future DNA test development to enable informed parental and seedling selection for dwarfing potential.
-
Key words:
- Architecture /
- Genomic region /
- Pear /
- QTL /
- Scion /
- Vigor