Evidence of Ozone-Induced Visible Foliar Injury in Hong Kong Using Phaseolus Vulgaris as a Bioindicator
by
 , ,
, ,
Felix Leung
1,* ,
,
Jacky Y. S. Pang
1, 
Amos P. K. Tai
1,2,
Timothy Lam
1,3,
Donald K. C. Tao
1 and
Katrina Sharps
4 1
Earth System Science Programme, Faculty of Science, and Institute of Environment, Energy and Sustainability, The Chinese University of Hong Kong, Sha Tin, Hong Kong, China
2
State Key Laboratory of Agrobiotechnology, The Chinese University of Hong Kong, Sha Tin, Hong Kong, China
3
Centre for Doctoral Training in Environmental Intelligence, University of Exeter, EX4 4PY Exeter, UK
4
UK Centre for Ecology & Hydrology, Deiniol Road, LL57 2UW Bangor, Wales, UK
*
Author to whom correspondence should be addressed.
Atmosphere 2020, 11(3), 266; https://doi.org/10.3390/atmos11030266
Submission received: 18 February 2020
/
Revised: 27 February 2020
/
Accepted: 1 March 2020
/
Published: 7 March 2020
(This article belongs to the Special Issue Biomonitoring of Air Pollution)
Abstract
:(1) Background: Hong Kong is one of the most densely populated cities in the world, with millions of people exposed to severe air pollution. Surface ozone, mostly produced photochemically from anthropogenic precursor gases, is harmful to both humans and vegetation. The phytotoxicity of ozone has been shown to damage plant photosynthesis, induce early leaf death, and retard growth. (2) Methods: We use genotypes of bush bean Phaseolus vulgaris with various degrees of sensitivity to ozone to investigate the impacts of ambient ozone on the morphology and development of the beans. We use ozone-induced foliar injury index and measure the flowering and fruit production to quantify the ozone stress on the plants. (3) Results: We expected that the ozone-sensitive genotype would suffer from a reduction of yield. Results, however, show that the ozone-sensitive genotype suffers higher ozone-induced foliar damage as expected but produces more pods and beans and heavier beans than the ozone-resistant genotype. (4) Conclusions: It is postulated that the high ozone sensitivity of the sensitive genotype causes stress-induced flowering, and therefore results in higher bean yield. A higher than ambient concentration of ozone is needed to negatively impact the yield production of the ozone-sensitive genotype. Meanwhile, ozone-induced foliar damage shows a graduated scale of damage pattern that can be useful for indicating ozone levels. This study demonstrates the usefulness of bioindicators to monitor the phytotoxic effects of ozone pollution in a subtropical city such as Hong Kong.

1. Introduction
Ground-level ozone (O3) is one of the main air pollutants that substantially threatens not only human health but also plant productivity [1,2,3,4,5]. The level of O3 has been increasing in Asia, especially in China where the rate of urbanization and industrialization has increased significantly in the last two decades [6]. One of the most economically developed and urbanized regions in China is the Pearl River Delta, which is situated in South China and has a population of around 67 million and a density of 1200 people per km2, with O3 exposure to people being amongst the highest in China [7]. Hong Kong, as a key economic hub of the region, is one of the most densely populated cities in the world but it also has one of the highest ratios of natural vegetation cover, which occupies ~40% of the landmass of Hong Kong [8], the highest as compared with other cities within the region. Its subtropical climate and high percentage of natural vegetation cover enables a high level of biodiversity, supporting numerous plant and invertebrate species that are endemic to Hong Kong. However, there are no studies on how O3 pollution affects the terrestrial ecosystems and vegetation in Hong Kong, and very few studies on similar subtropical cities worldwide. Here, we use a bioindicator species Phaseolus vulgaris to investigate the impacts of ambient O3 pollution on vegetation in Hong Kong.
The most significant direct effects of O3 are on plant growth and leaf physiology. Since plants are the primary producers in terrestrial ecosystems, O3 damage to plants can scale up to higher trophic levels and cause indirect effects. The flux of O3 into the leaf is regulated by a series of aerodynamic, boundary layer and surface resistances, and is ultimately controlled by leaf openings called stomata. The O3 flux varies greatly through space and time with meteorological conditions and plant ecophysiology [9]. The O3 impact on a leaf depends on the detoxification capacity for the incoming O3 flux. There are two modes of action of O3 within the leaf. At high exposure to O3, the flux overwhelms the detoxification capacity and most of the O3 is not detoxified, causing direct damage to the leaf. At a low exposure of O3, it can induce the defense reactions and gene expression in the plants, which require energy to regenerate antioxidants and de novo synthesis (synthesizing complex molecules from simple molecules), ultimately resulting in a decreased carbon assimilation rate for plant growth [9]. When integrated over time, the direct impact of tropospheric O3 on plant net primary productivity (NPP) is determined by the rate of O3 penetration into the leaf (the instantaneous and cumulative stomatal O3 flux) and the leaf tolerance to reactive oxygen species (ROS) generated by O3 oxidization [3].
On a biochemical level, O3 impact to a leaf can be evaluated by the reactions of O3 with different plant components. The first barrier against O3 entering the intercellular space of the mesophyll is the stomatal aperture. Once O3 reaches the intercellular space, it reacts with chemicals in the apoplast and produces ROS such as hydrogen peroxide and hydroxyl radicals, which stimulate the production of ascorbic acid (ABA), acting as the first line of defense against O3 damage [10,11,12]. With acute exposure to a high level of O3 (>150 ppb), the stress response of the plant is activated; ROS, stress hormones, Ca2+, and mitogen-activated protein kinase (MAPK) begin to appear through a cascade of signals. The O3 response pathway overlaps with the programmed cell death induced by pathogens because both stresses amplify ROS production. In the long run, it causes early senescence and decreased photosynthesis rate. This visible ozone injury is observed all over the world where O3 concentration is high [13,14]. Experiments on the O3 impact on Arabidopsis in a controlled environment [15,16] show that a minimum of a 80 ppb O3 exposure episode is required to trigger the rapid transient decrease in stomatal conductance [17]. However, long-term chronic exposure to low concentration of O3 still causes irreversible damage to leaves. It impairs the stomatal guard cell aperture; the stomata are then unable to close rapidly in response to environmental stimuli. Ozone also further reduces the sensitivity of the stomata to the plant stress hormone (e.g., ABA) signals [10]. This phenomenon implies that when plants are exposed to a drought and O3 stress at the same time, they continue to lose water through transpiration, resulting in desiccation [18]. The sensitivity of photosynthetic and stomatal biology to O3 varies greatly between species and with the age of individuals [19,20].
Plants have been widely used as biomonitors and bioindicators for air quality in the past. For example, Trifolium repens is used for air pollution genotoxicity assessment [21]. Moss and lichens are useful for monitoring the level of heavy metal and nitrogen pollution [22,23,24]. Plants that could grow in a wide range of habitats and with bioaccumulative properties are suitable candidates as bioindicator species, but, on the one hand, often chemical analysis is required to quantify the level of bioaccumulation of certain pollutants such as heavy metals [25,26]. Ozone pollution on the other hand usually generates visual symptoms on the plant leaves and it is easier to quantify using the naked eye and relatively simple measurements [27,28].
Ozone injury can be divided into acute injury and chronic injury. Acute injury is symptomatic, showing visible symptoms on leaves, while chronic injury is generally less visible and includes changes in growth, yield, and fruit quality [29,30]. Surface O3 causes visible injury on plants, impairs photosynthesis, generally reduces yield and growth, and intervenes with the interactions of plants with diseases and pests [31]. On a global scale, O3 pollution reduces the carbon uptake of forests (e.g., [32,33]) and also poses significant threats to food security because of crop yield reductions (e.g., [1,2,3]). Visible injury of leaves due to O3 is an easily observable characteristic that indicates the O3 level in the environment [27]. It is a valuable tool for O3 impact assessment as it indicates the relative O3 stress of the species [34,35,36].
Each species displays distinctive visible foliar O3 injury patterns [27,37,38]. Bush bean (Phaseolus vulgaris L.) is chosen in this study because it displays a distinctive red or bronze mottle pattern on the leaves [39]. It also has a wide geographical distribution, and is able to grow in tropical, subtropical, and temperate climates. It has a short growing season of around four months and is able to produce quantifiable results of ozone impact more easily via measuring the O3 foliar injury and yield. Bush bean is also a common edible bean found in the diets of many cultures, and thus the visible impacts of its damage by ozone can be more relevantly be translated to implications for food security.
O3 bioindicators show that ambient O3 concentrations were high for a specific place and time and also show the conditions that allow O3 uptake and injury such as the nutrition and soil moisture. A physical O3 analyzer only provides immediate absolute concentration of O3 but a bioindicator provides a visible record of the accumulation of O3 and the biological relevance.
Here, we investigate how ambient O3 affects the phenotypic and developmental differences between two genotypes of a single cultivar of Phaseolus vulgaris. Our objectives are to demonstrate the impacts of ambient O3 exposure on the development of bush bean and its usefulness as a biomonitor and bioindicator for O3 pollution in a subtropical city, and to develop a framework to approximate O3 concentration of an environment where accurate measurements are unavailable by measuring the visible O3 foliar injury.
2. Experiments
2.1. Plant Materials and Gardening
This study used the ozone-sensitive (S156) and ozone-resistant (R123) genotypes of Phaseolus vulgaris (bush bean, French dwarf bean) that were selected from the United States Department of Agriculture, Agricultural Research Service (USDA-ARS) Plant Science Unit field site near Raleigh, North Carolina, USA. The bean lines were developed from a genetic cross reported by Dick Reinert as described in Reinert and Eason (2000) [40]. Individual sensitive (S) and tolerant (R) lines were identified, the S156 and R123 lines were selected, and then tested in a bioindicator experiment reported in Burkey et al. (2005) [41]. This system has been tested in the central and southern parts of Europe, since 2008. Burkey et al. (2005) of USDA-ARS kindly provided seeds for the trials [42].
We followed the bean biomonitoring protocol from the International Cooperative Programme on Effects of Air Pollution on Natural Vegetation and Crops (ICP vegetation) [42] for growing and recording bean growth. An ozone garden was established inside the campus of The Chinese University of Hong Kong in an experimental plot called the Gene Garden (latitude 22.4248°, longitude 114.2068°). It is considered as a rural area as there is only one building nearby (situated 50 m away). The plot was fenced to prevent mammals such as wild boars or macaques from entering the garden and eating the plants.
For the experimental growth period from 14 January to 15 April 2019, we followed the bean growing protocol from ICP vegetation [43] to germinate the beans in two 15 L pots and 25 cm surface diameter for each genotype with a soil mixture of 50% peat soil and 50% sand. When the primary leaves emerged, we transplanted the seedlings carefully to another pot. There were 12 sensitive and 15 resistant beans that successfully germinated. Only 12 out of 15 resistant beans were considered in this study as the rest of them were grown slightly earlier than the main batch and were exposed to slightly different growing conditions. As an addition to the protocol for ICP vegetation, an insect-proof net was put over the two rows of beans to minimize insect damage. The insect net has a mesh size of 1.2 mm, which is a common size for commercially available mosquito net. The pots were lined up and fitted with an automatic watering system developed by B-Hyve, which is widely used in commercial farming. A timer was set to water the beans every morning at 8:45 a.m. for 1 min.
2.2. Ozone Monitoring and Meteorological Measurements
We monitored the ozone concentration in the ozone garden using a Teledyne ozone analyzer Model 400A UV Absorption (San Diego, USA) [44] that was set up at the Gene Garden. The analyzer used a system based on the Beer–Lambert law for measuring low concentration of O3 in ambient air. The ambient O3 concentration is detected from the internal electronic resonance of O3 molecules using absorption of 254 nm UV light emitted from an internal mercury lamp [44]. It provided accurate measurements up to 0.1 ppb and the data were logged every 5 min. The ozone analyzer was placed in a shed near the beans.
We also measured local meteorological variables using the Vantage Due Pro 2 weather station installed on the field site. Wind speed (m s–1), wind direction (degree ° from north), temperature (°C), precipitation (mm), air pressure (hPa), radiation (W m−2), and relative humidity (%) were recorded every 5 min. The meteorology of the field site and pictures of the experimental setup are shown in the Appendix A.
2.3. Insect Injury Monitoring
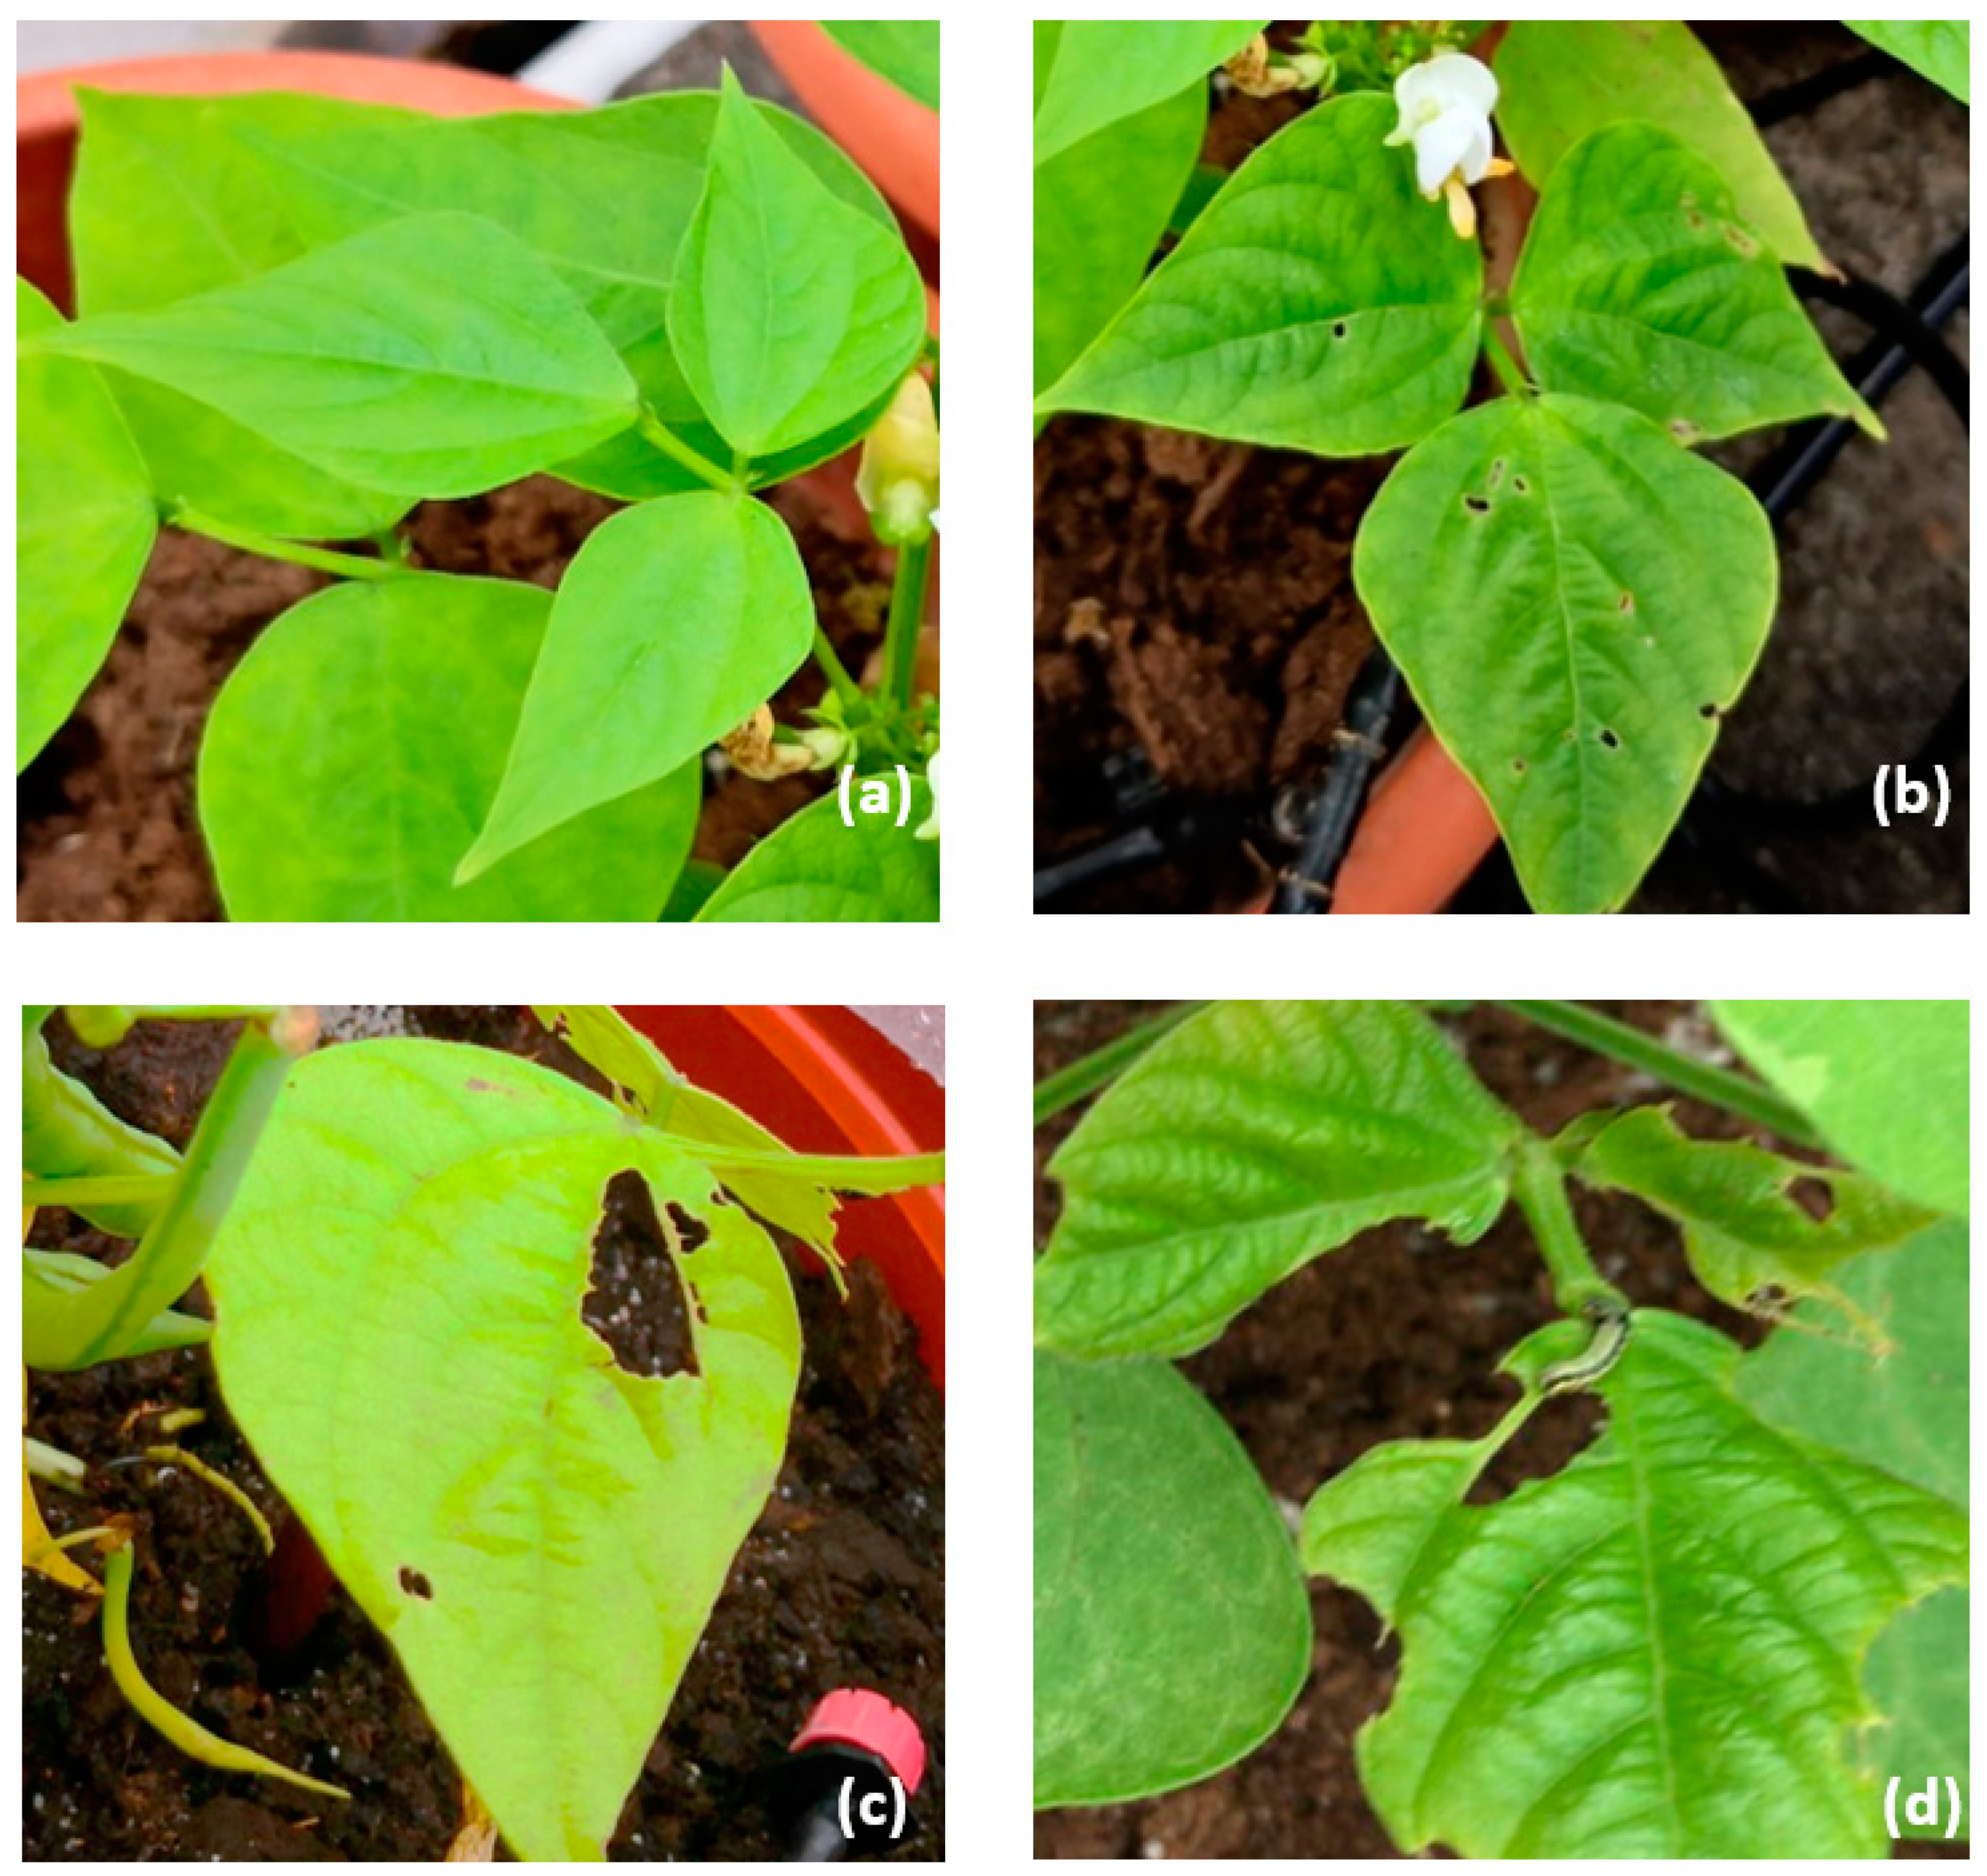
From our trial study, we found that many plants suffered from various degrees of insect injury on the leaves, and insect injuries are an important indicator of plant health, complicating the observation and interpretation of ozone injury (Figure 1). Still, it is possible to differentiate insect injury from ozone injury as only the former is characterized by the deformation of leaves. We recorded the amount of insect damage by observing the percentage of the leaf that was missing from the trifoliates (3 sub-leaves). It is divided into the following four categories: no damage, 1% to 5% damage, 6% to 25%, and over 25% damage.
2.4. Ozone Injury Monitoring
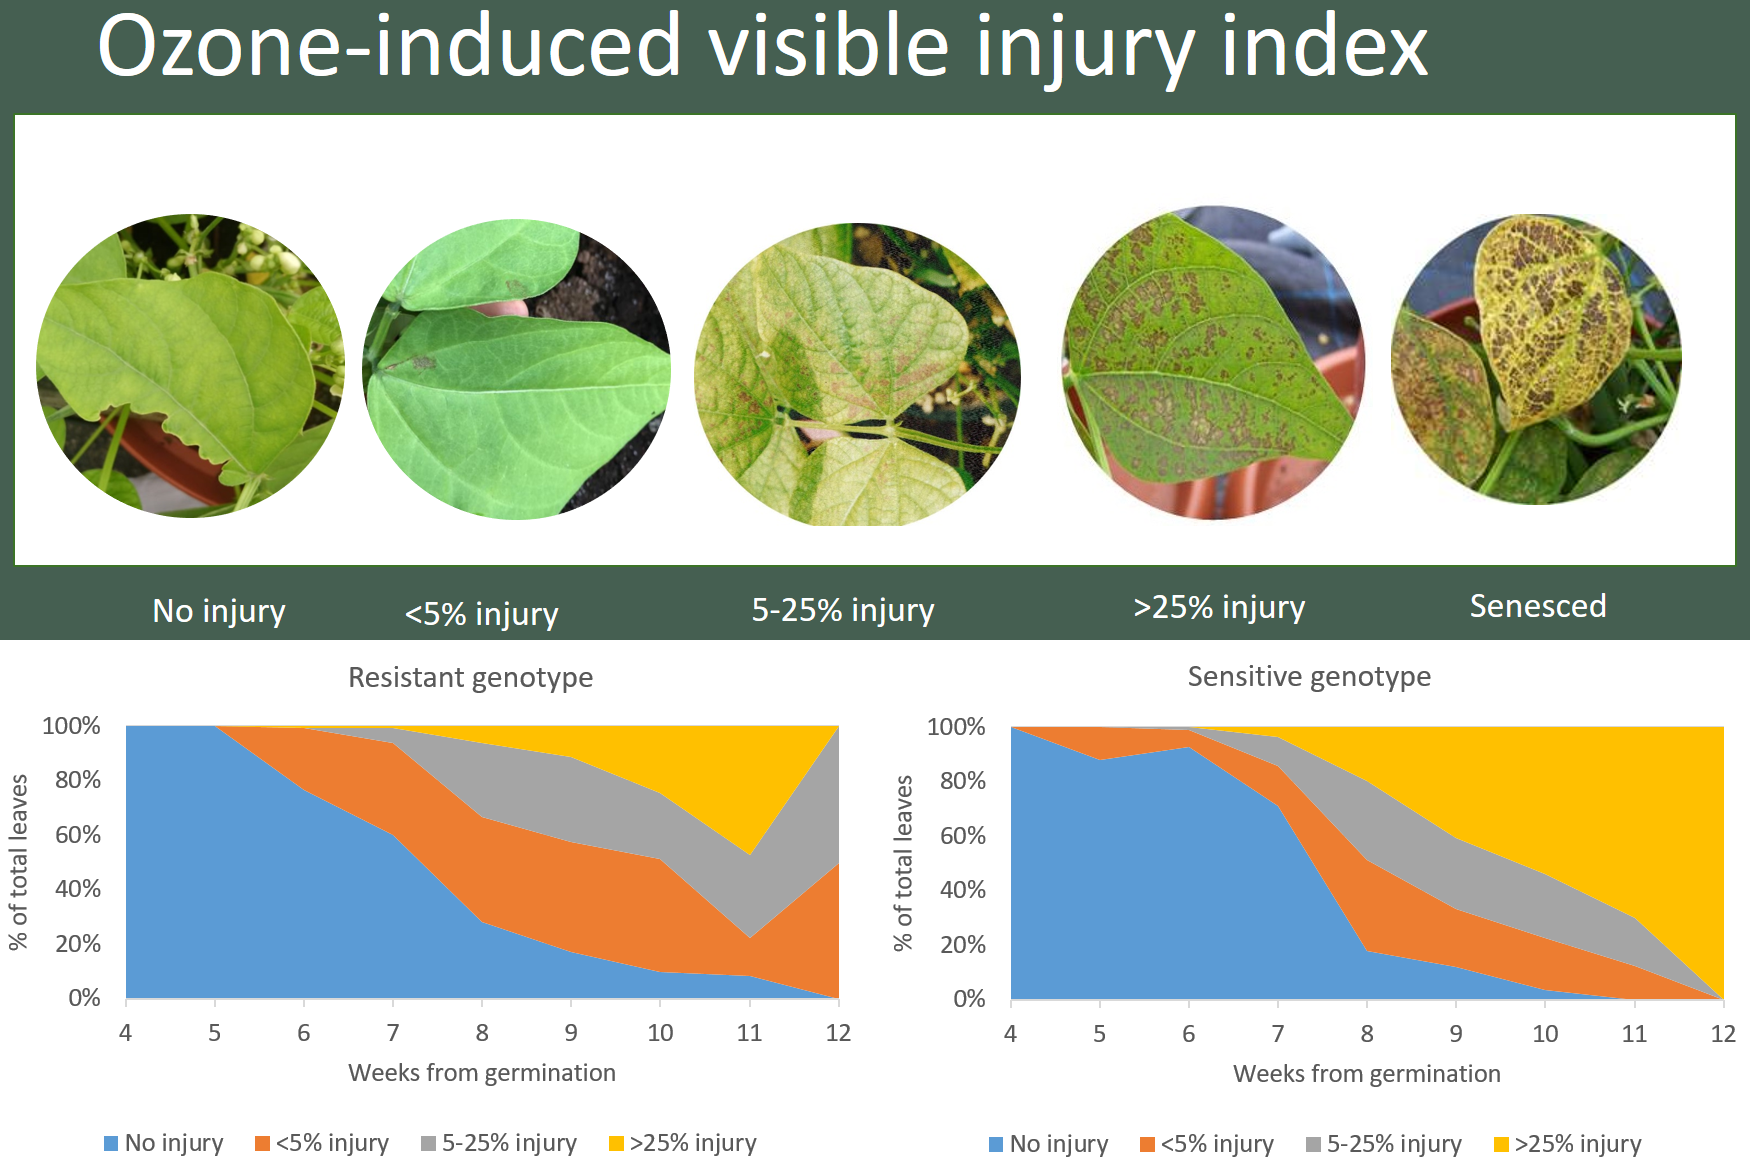
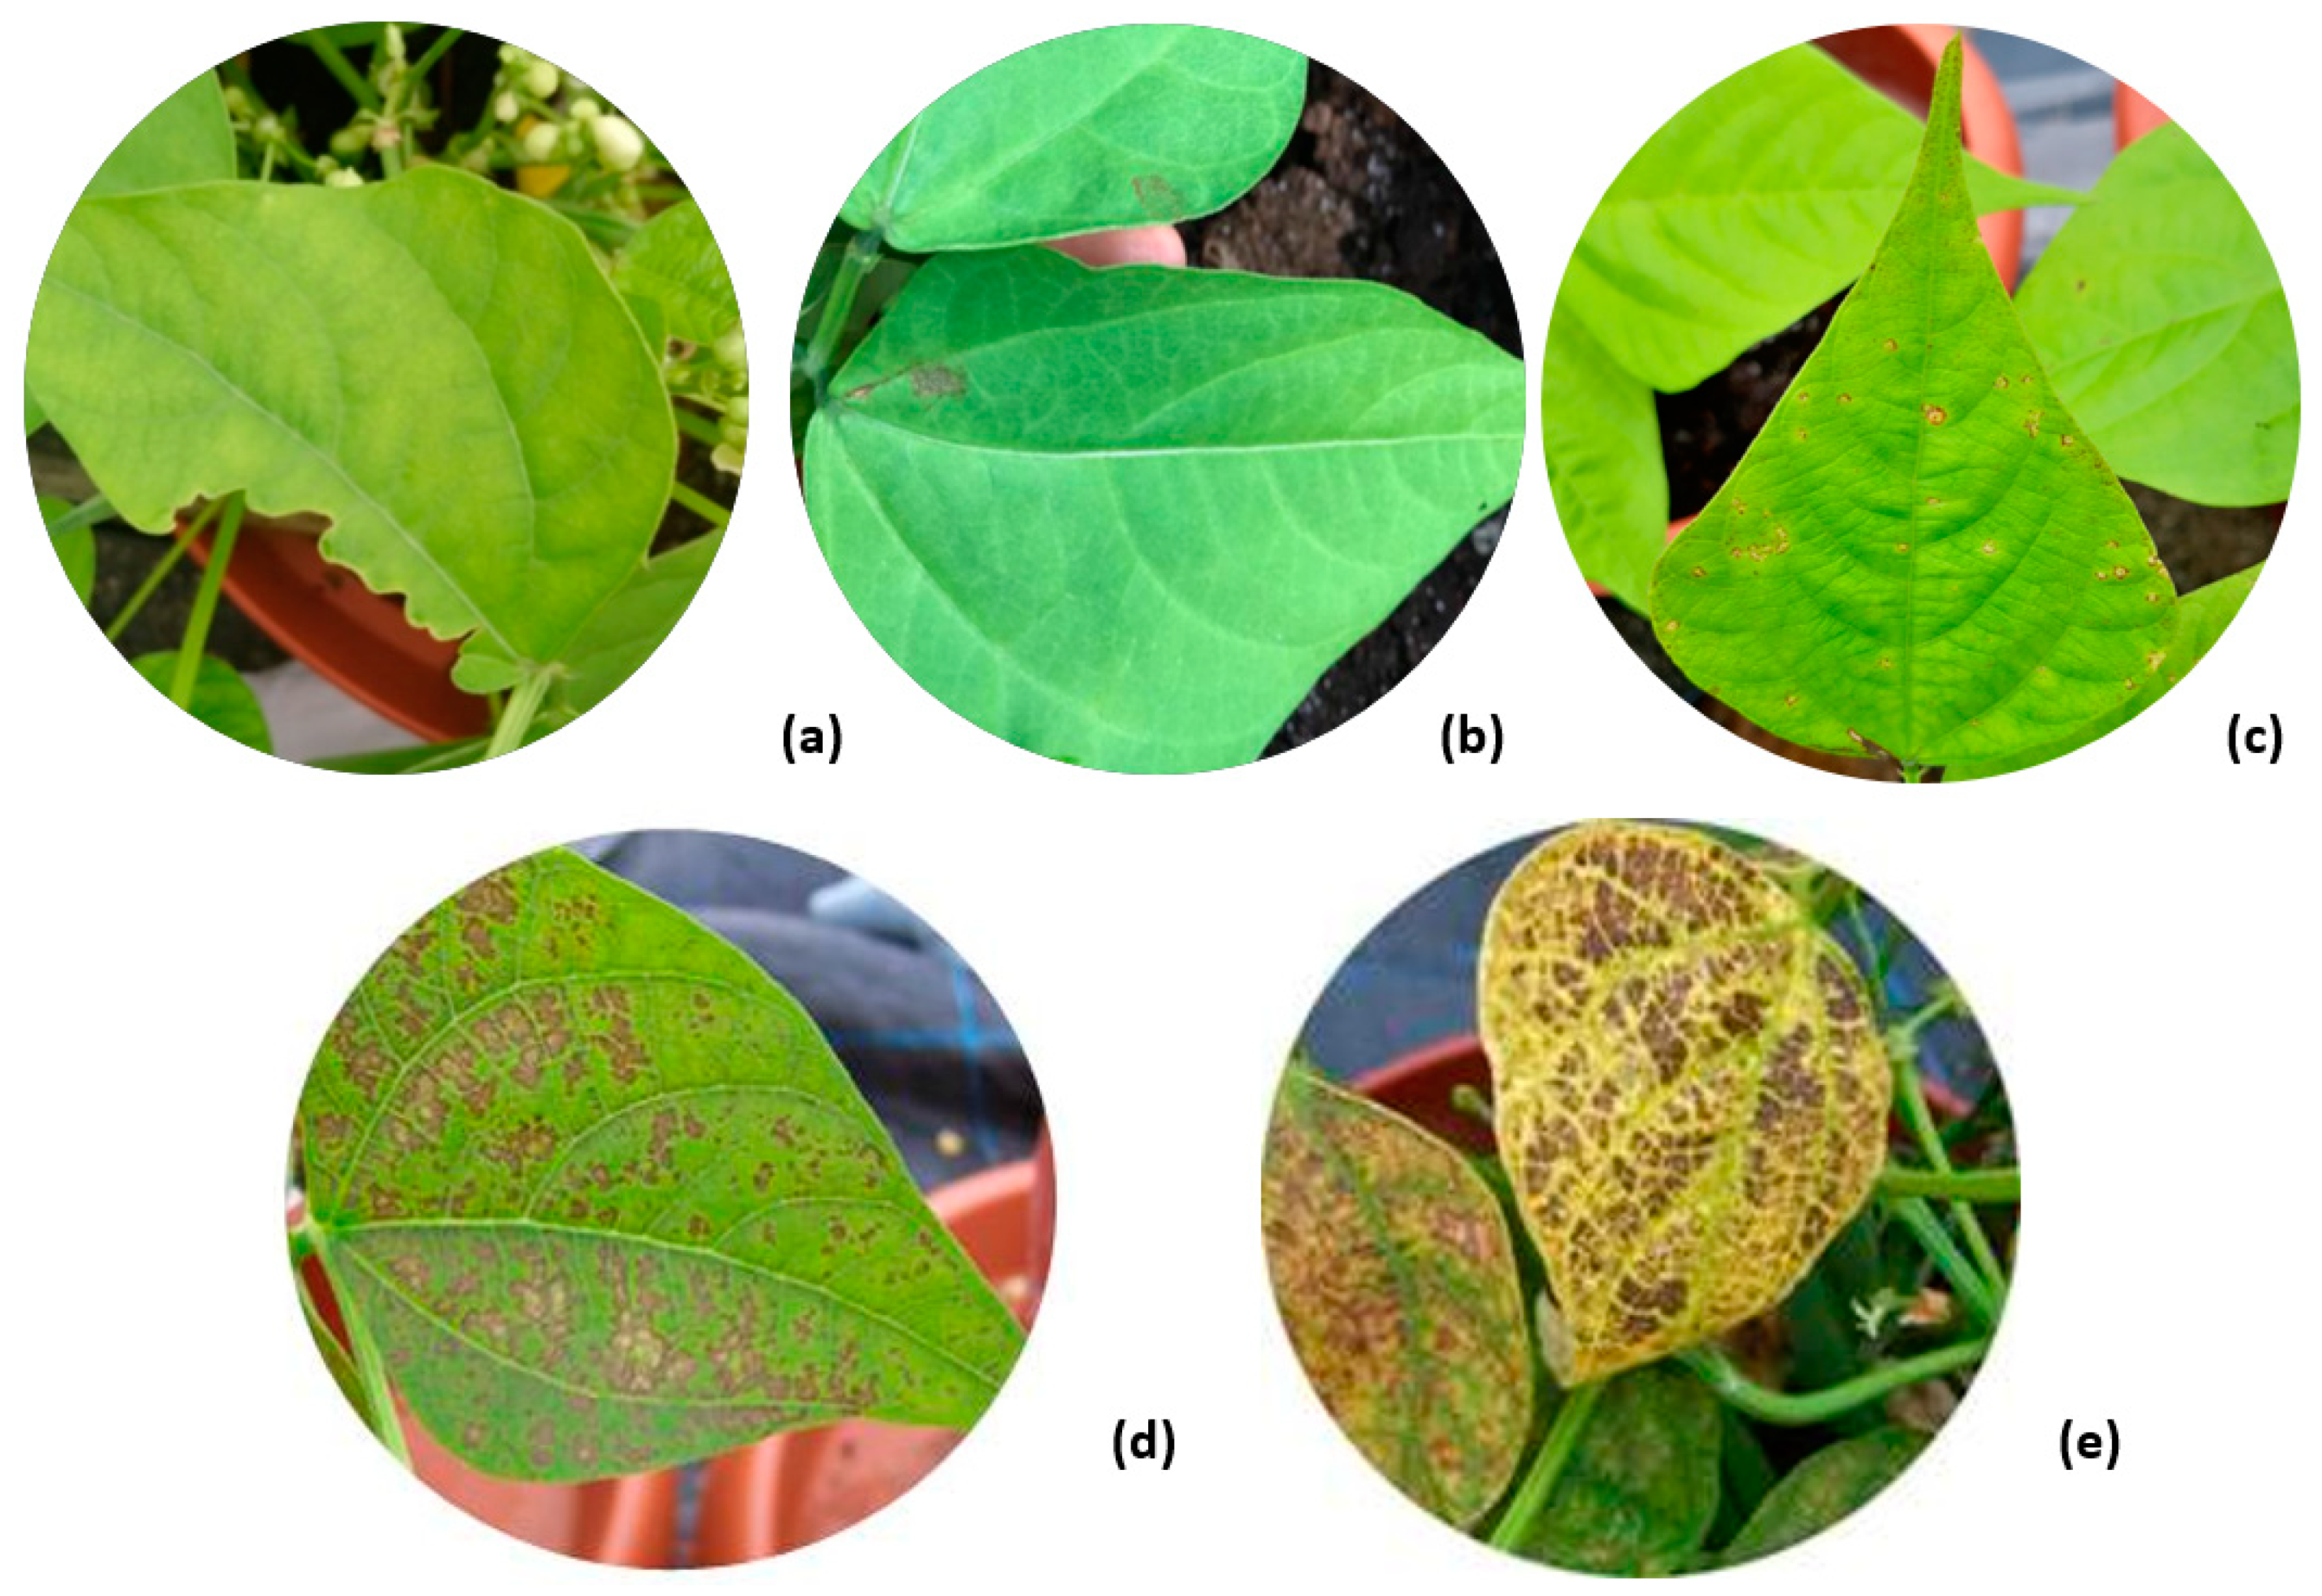
According to the bean biomonitoring protocol from ICP vegetation [42], we classified the ozone injury intensity into the following five categories: without any injuries (none), larger than 0% but less than 5% injury (mild), with 5% to 25% injury (moderate), with greater than 25% injury (severe), and with senesced leaves (dead). The O3 injuries on Phaseolus vulgaris are exemplified by some distinctive bronze red dots that appear on the surface of the leaves, and the O3 injuries are very different from insect damages and it can be easily identified following established protocol. Figure 2 shows an example of these five categories of O3-induced damage on leaves.
We compared and contrasted the differences between O3 sensitive and O3-resistant beans by quantifying the O3 injuries on leaves. We also measured the number of flowers and pods developed as this information is important for calculating the carbon allocation during flowering. We harvested the beans when 50% of the pods had turned brown. The pods were weighed to get the wet weight, and then dried in an oven at 40 °C for 24 h and weighed again to obtain the dry weight. The number of beans inside each pod was recorded and each bean was weighed individually.
2.5. Statistical Analysis
The R programming language [45] was used for all statistical analyses. Student’s t-test was used to test for differences of normally distributed data such as bean weight and plant age between the two bean genotypes, in this study. Generalized linear model with Poisson regression was used to analyze count data such as the number of pods and the number of beans between the two genotpyes. The Chi-square test was used to analyze binominal data such as the differences in successful and unsuccessful pod development, live and dead pods, and insect damage. The standard deviation and difference significance level are displayed in Table 1 and Table 2.
For the visible leaf injury data, we followed the statistical methodology performed by Hayes et al. (2019) [20], who tested if the proportion of leaves per injury category varied with the genotype of the bean. We used the “multinom” function in the “nnet” package in R [45,46] to perform a multinomial logistic regression models on the relationship between leaf injury and genotype. Models were run separately for four dates that represented different development stages of the beans: 19 February 2019 (growing), 4 March 2019 (flowering), 18 March 2019 (fruiting), and 28 March 2019 (harvest). For each date, two linear models (M1, injury~genotype and M2, injury~1) were tested, and the optimal model was chosen according to the lowest akaike information criterion (AIC) values, following the methods from Zuur et al. (2009) [47]. Models differing in 2 to 7 AIC units from the top model had little empirical support [48]. The AIC values are shown in Table A2. Post-hoc testing was carried out by comparing the simulated predicted probabilities per genotype for a chosen level of damage using paired t-tests, in Table A3.
3. Results
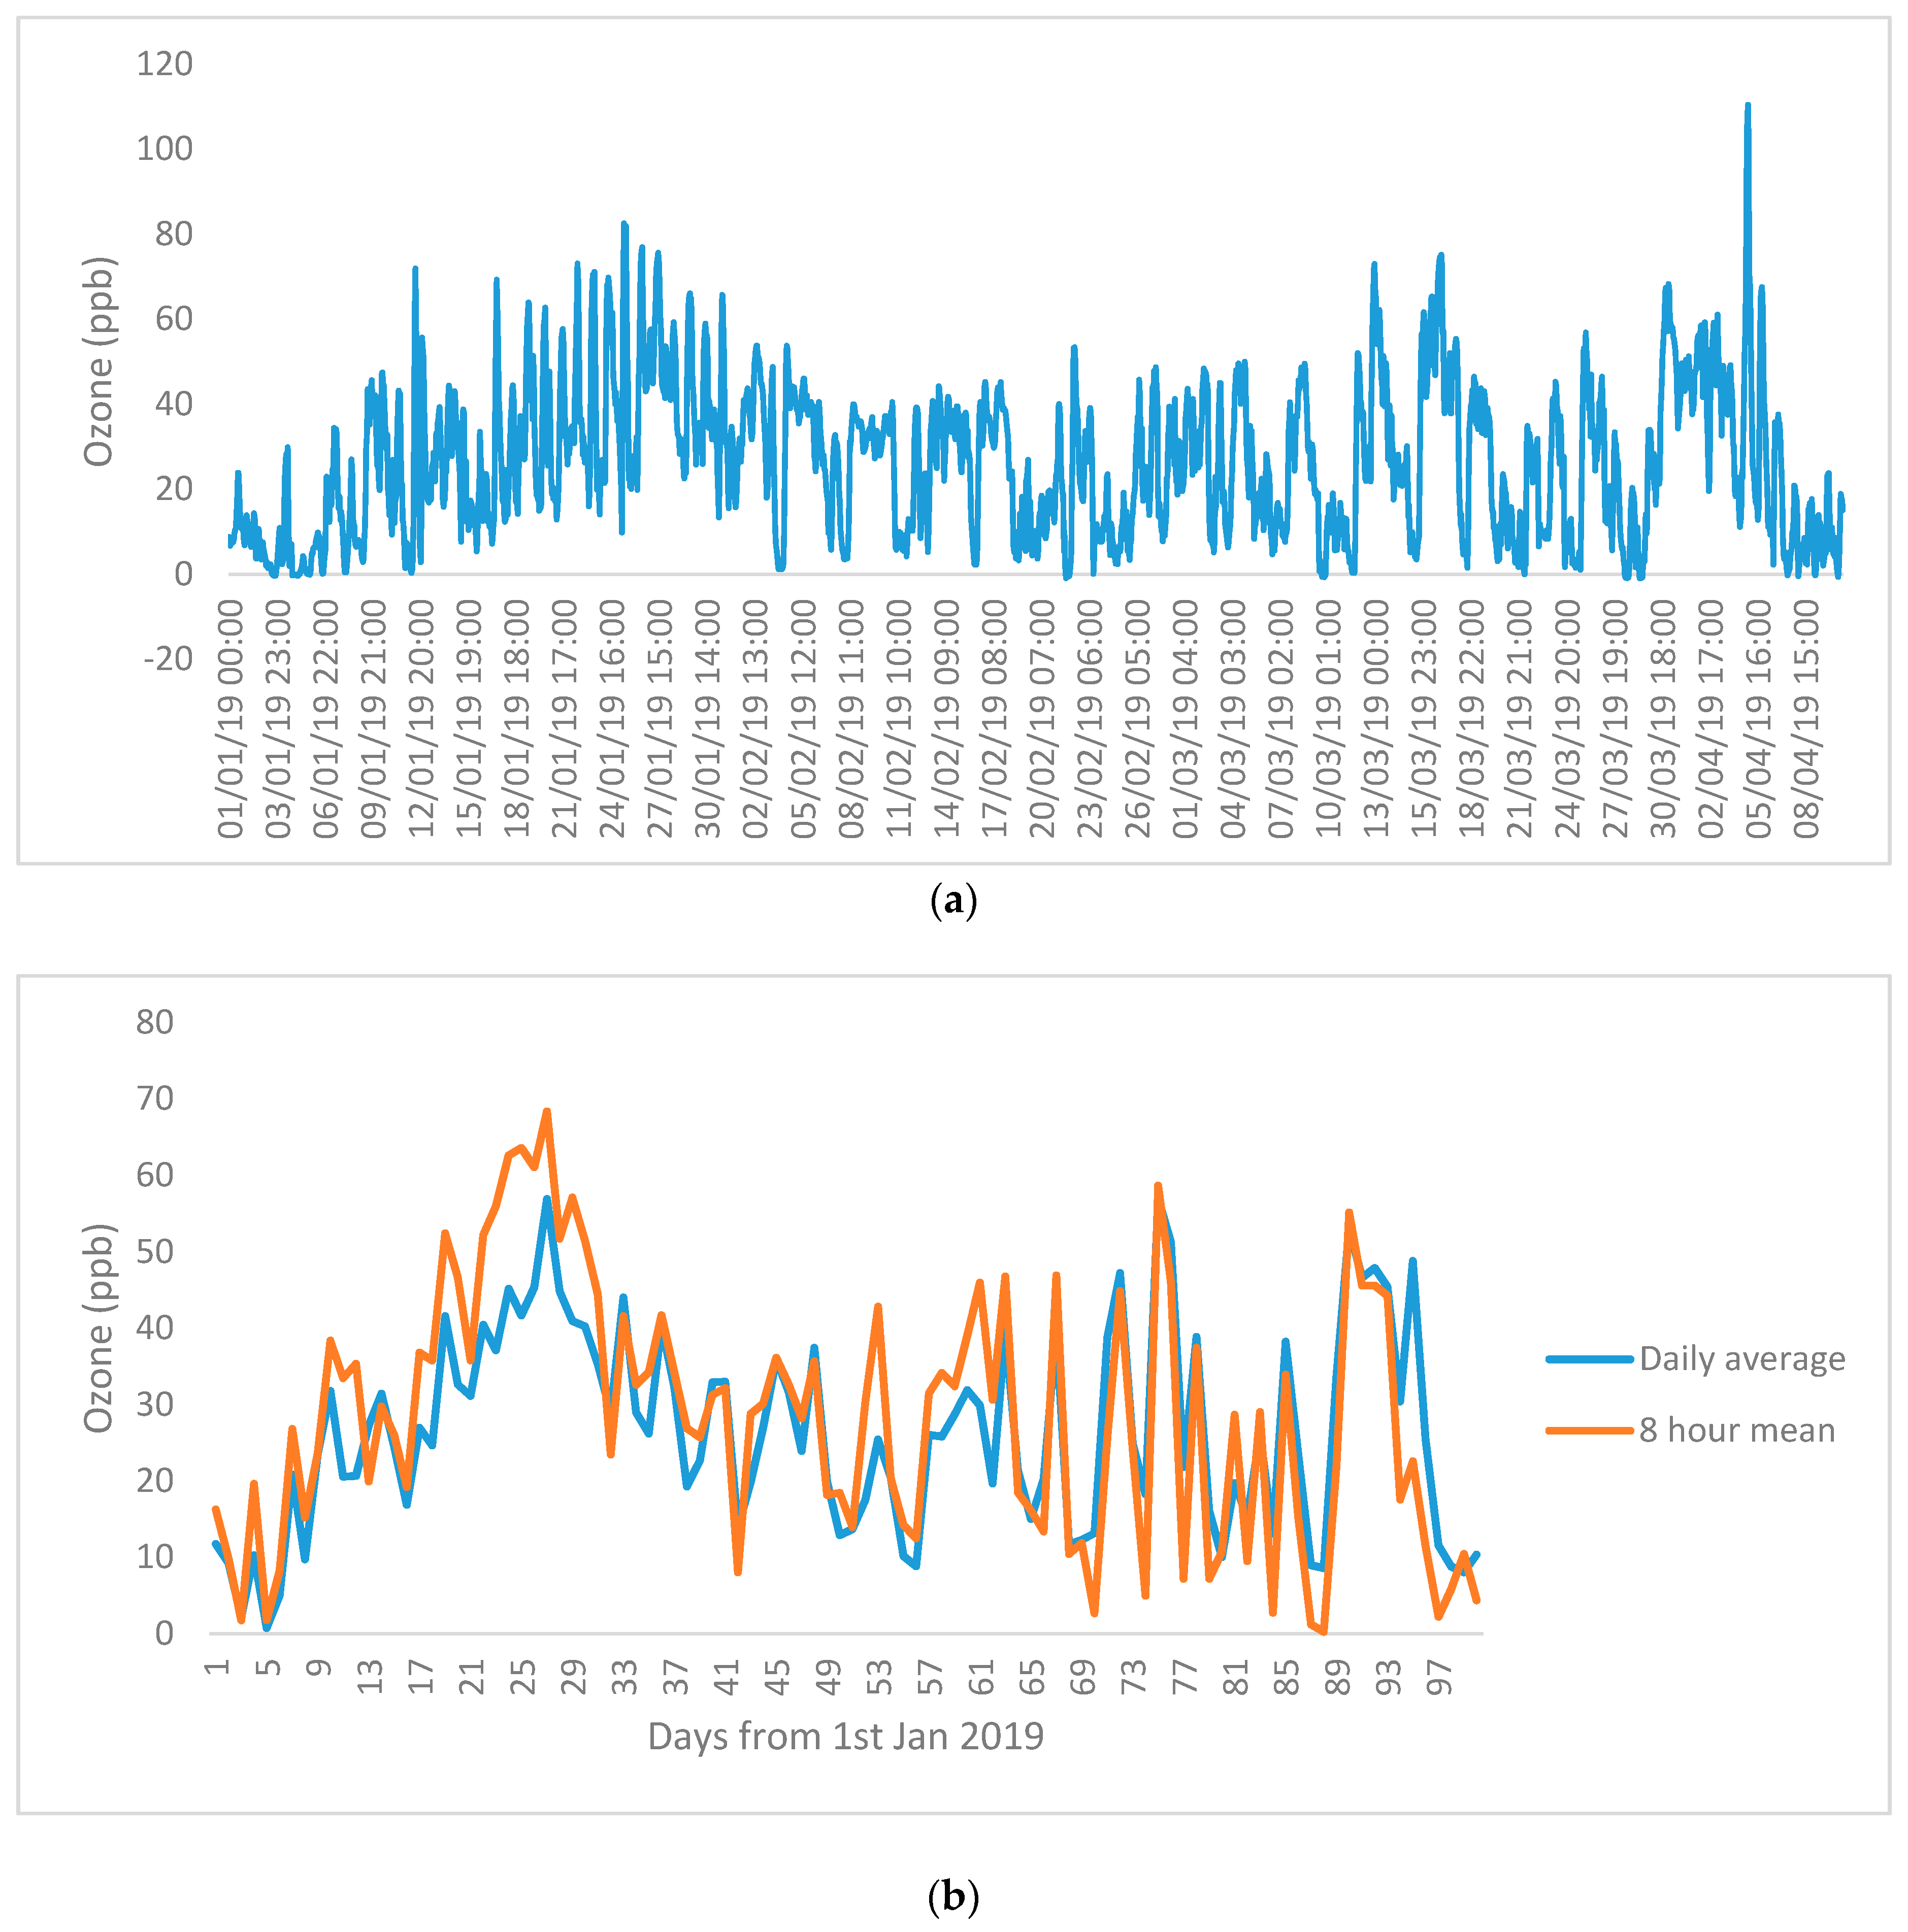
The O3 level in the study site was monitored continuously from the beginning of 2019 to May 2019. The O3 level of the growing period until the time of harvest is shown in Figure 3. The O3 level varied between 40 and 70 ppb during daytime and with a background O3 level of 10 ppb during night time. It had a peak O3 concentration of ~100 ppb in early April. The plants were exposed to O3 concentration that exceeded 60 ppb for 22 days, with two days on which the O3 concentration exceeded 80 ppb (Figure 3).
To track the age of the plant, we measured the germination dates of the beans. Table 1 shows that the sensitive genotype took a longer time (mean of 79 days) to complete the life cycle than the resistant genotype (mean of 75 days). In addition, it took a longer time for the sensitive genotype to reach the flowering stage (mean of 40 days) than that of the resistant genotype (mean of 38 days). The differences are not statistically significant due to the small number of sample size.
The average number of beans per plant and average number of beans per pod are not significantly different between the sensitive and resistant genotype (Table 1). The mean number of beans per pod are the same for both genotypes, which is three beans per pod. Please note that it includes pods that do not have any beans into the counting. The mean number of beans per plant for the resistant and sensitive genotype is 10.7 and 11.3, respectively. According to Table 1, the sensitive genotype has (p-value < 0.01) heavier beans (0.24 g) than the resistant one (0.21 g), and this leads to an overall higher total bean yield for the sensitive (mean of 2.69 g) as compared with the resistant genotype (mean of 2.09 g), however, the difference is not statistically significant due to the small sample size of the plants. The variations among the sensitive beans are higher, with some plants that had the complete harvest destroyed by pests, causing no yield at all. We included these plants in our analysis in order to be consistent with the O3 leaf injury analysis.
The mean of the maximum number of flowers grown per plant is 12.7 ± 5.7 for the sensitive genotype while for the resistance genotype it is 8.1 ± 2.3. The sensitive genotype has a statistically significant (p-value < 0.01) higher number of maximum flowers than the resistant genotype. The higher number of flowers for the sensitive genotype also leads to a higher number of fruiting (Table 1), with a mean of 5.9 pods per plant which is higher than the resistant one which has a mean of 4.9, however this difference was not statistically significant.
Table 2 shows the resistant plants have significantly (p<0.05) higher successful fruit development than the sensitive genotypes. This means that the sensitive genotypes produce more flowers but only a small number of them can develop into pod. Please note that there was one individual sensitive plant with very high insect damage and O3 injury and did not produce any pods with beans.
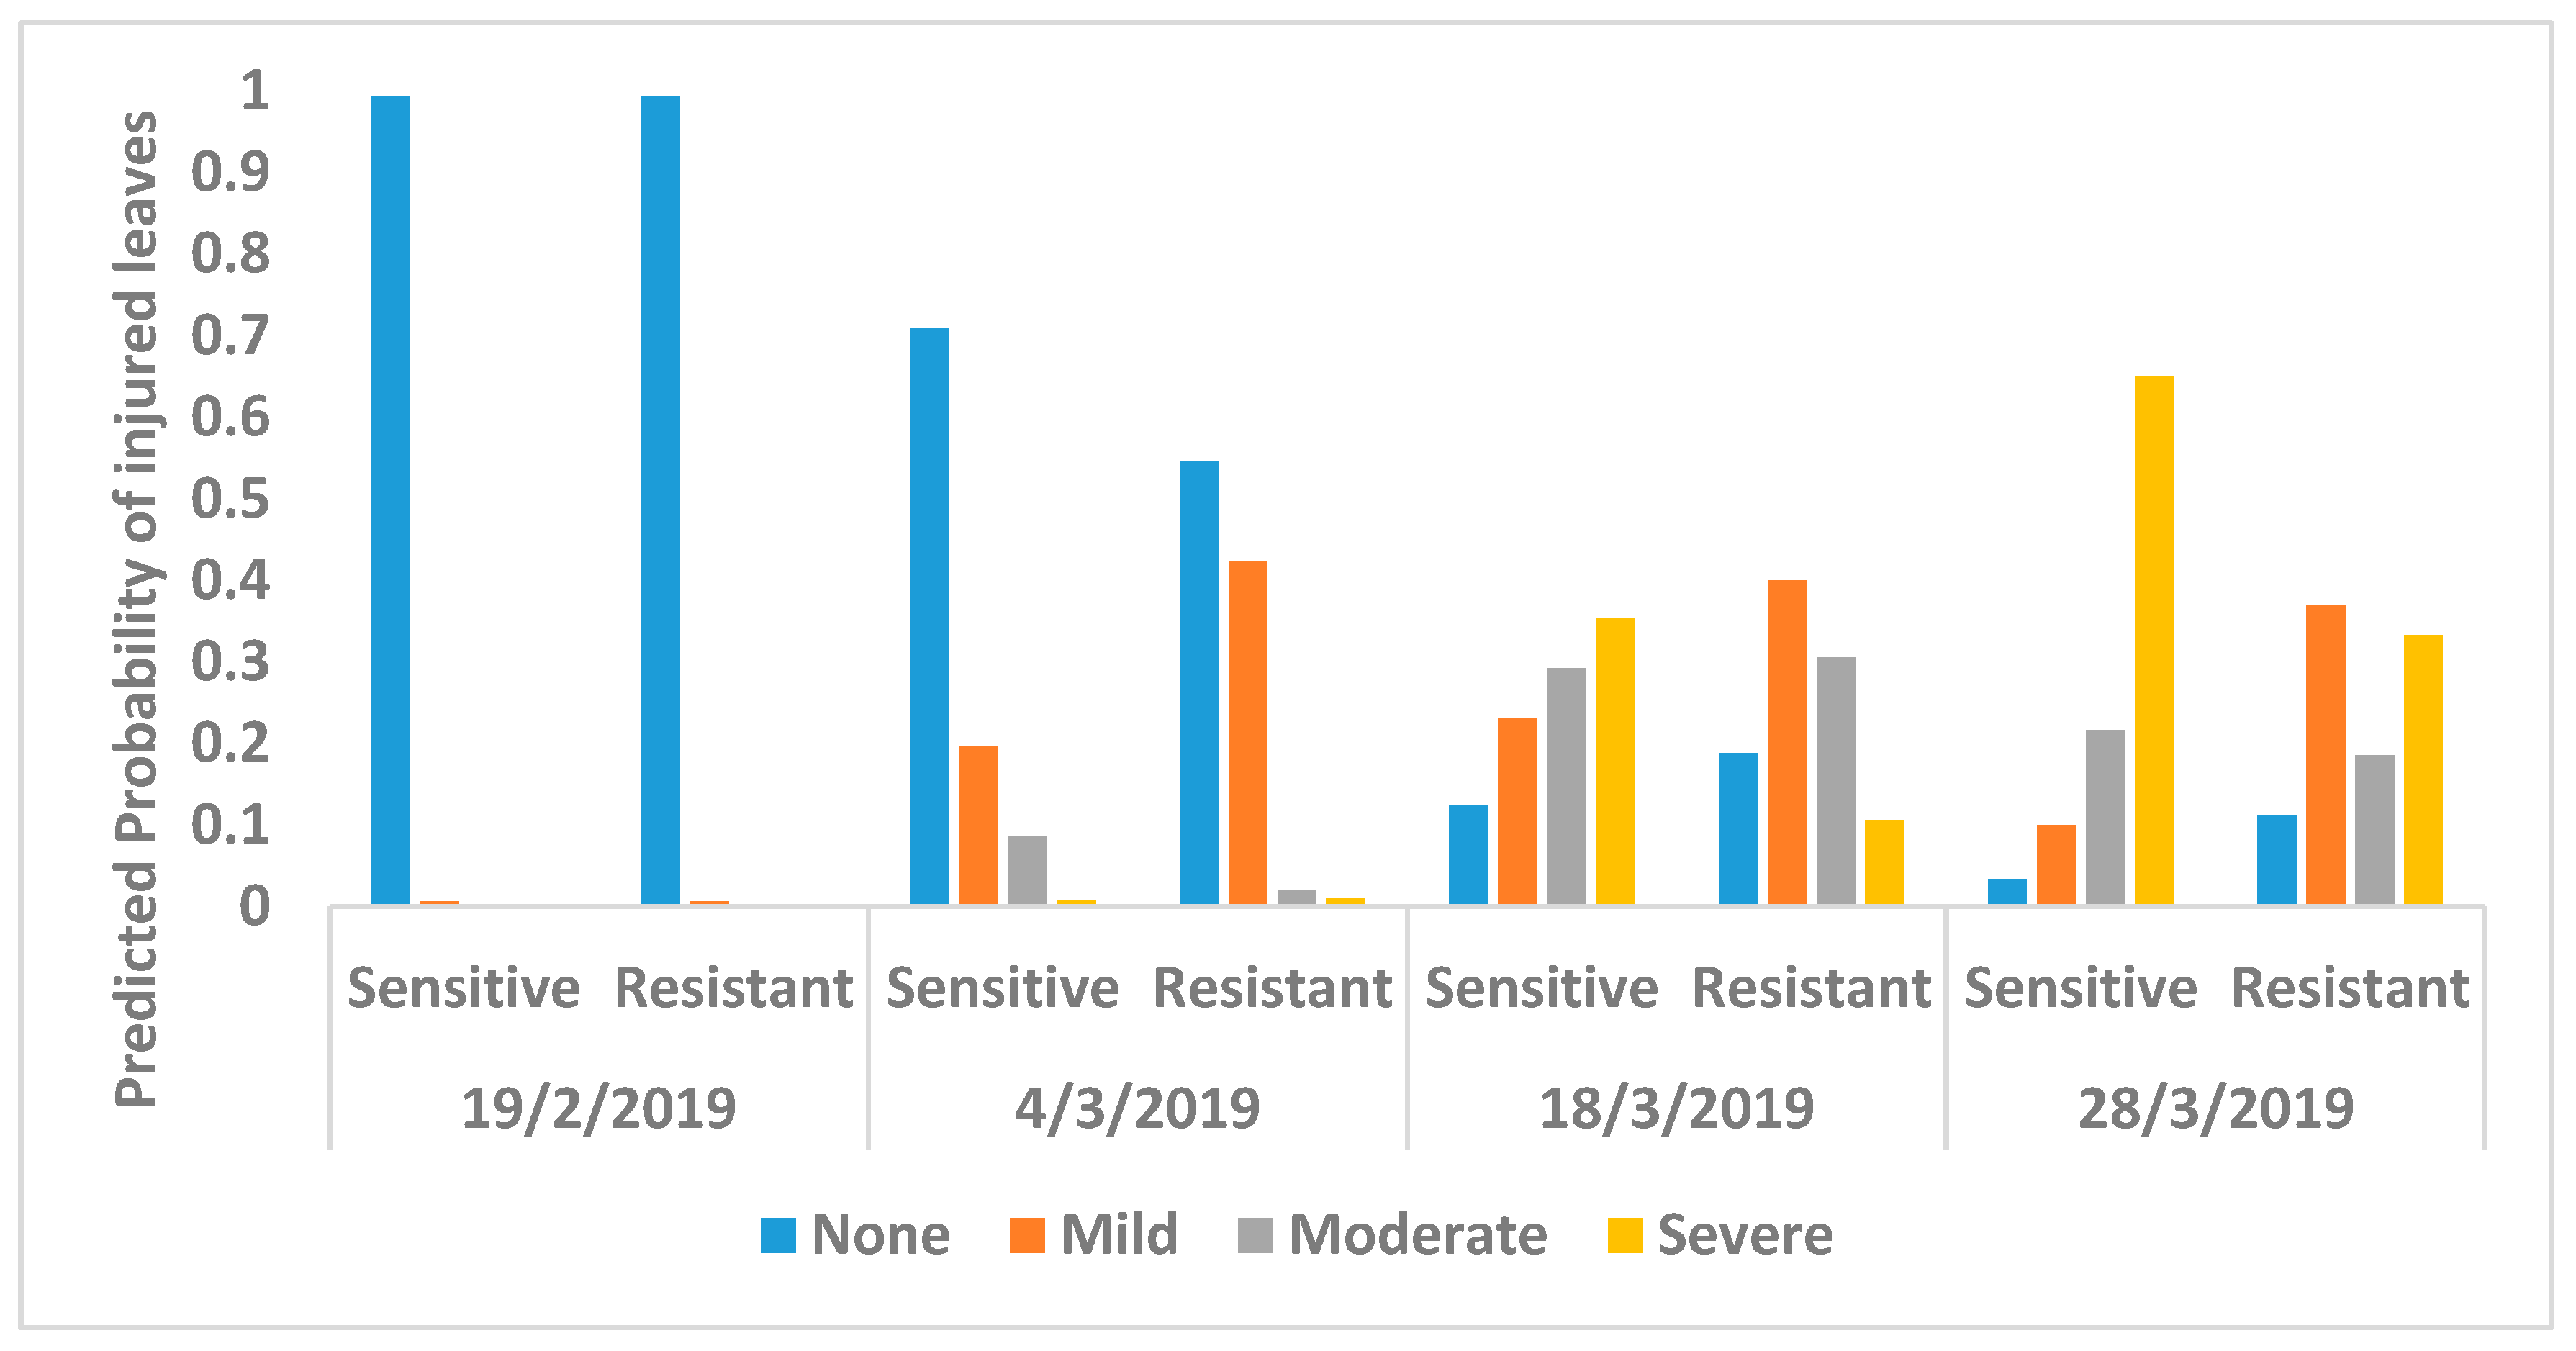
Figure 4 shows the predicted probability of leaves with various degrees of O3 injury using the multinominal logistic regression model. It shows that both genotypes showed evidence of mild visible leaf injury after 36 days from the sowing date on 14 January 2019. There was no difference in O3 injury between the genotypes on 19 February 2019 (Figure 4 and Table A2). On 4 March 2019, counts of O3 leaf injury differed between the two genotypes with the resistant genotype showing significantly more mild O3 injury than the sensitive genotype, but the sensitive genotype showed more moderate injury (p < 0.001)(Figure 4 and Table 2). Two weeks later on 18 March 2019, again there was a clear difference between the genotypes; most noticeably, the sensitive genotype showed significantly more severe O3 injury than the resistant genotype (p < 0.001). Finally, on 28 March 2019, the clear difference between genotypes remained, with the sensitive genotype again showing significantly higher moderate and severe injury than the resistant genotype (p < 0.001). The average proportion of tTabotal number of leaves with O3 injury for the four dates are shown in Figure A3 and the progression of leaf injuries from week four to harvest are shown in Figure A4.
Overall, we find that the bean weight and maximum number of flowers are the only parameters that display significant differences between the sensitive and resistant genotypes. The number of successful fruit development also gives a significant result (p-value < 0.05) (Table 2).
4. Discussion
The overall results show a higher average yield for the O3-sensitive beans than the resistant ones, however, the difference was not statistically significant, possibly due to the small sample size of plants. This overall result is consistent with the study by Elagöz & Manning (2005) [29], in which the sensitive genotype produced heavier beans with a higher variation in bean weight and number of beans per pod. Table 2 also shows that the resistant genotype had a higher successful rate of fruiting development from flowering to bean formation, and it had fewer immature or dead pods than the sensitive one (Table 1), however, the difference was not statistically significant because of the same reason mentioned. This overall result implied that the resistant genotype has a better energy use efficiency in reproduction than the sensitive one. Moreover, it suggests that the resistant plant is able to reach maturation and senescence more consistently than the sensitive one. The consistency of crop development is useful for farmers to predict yield for the coming growing season.
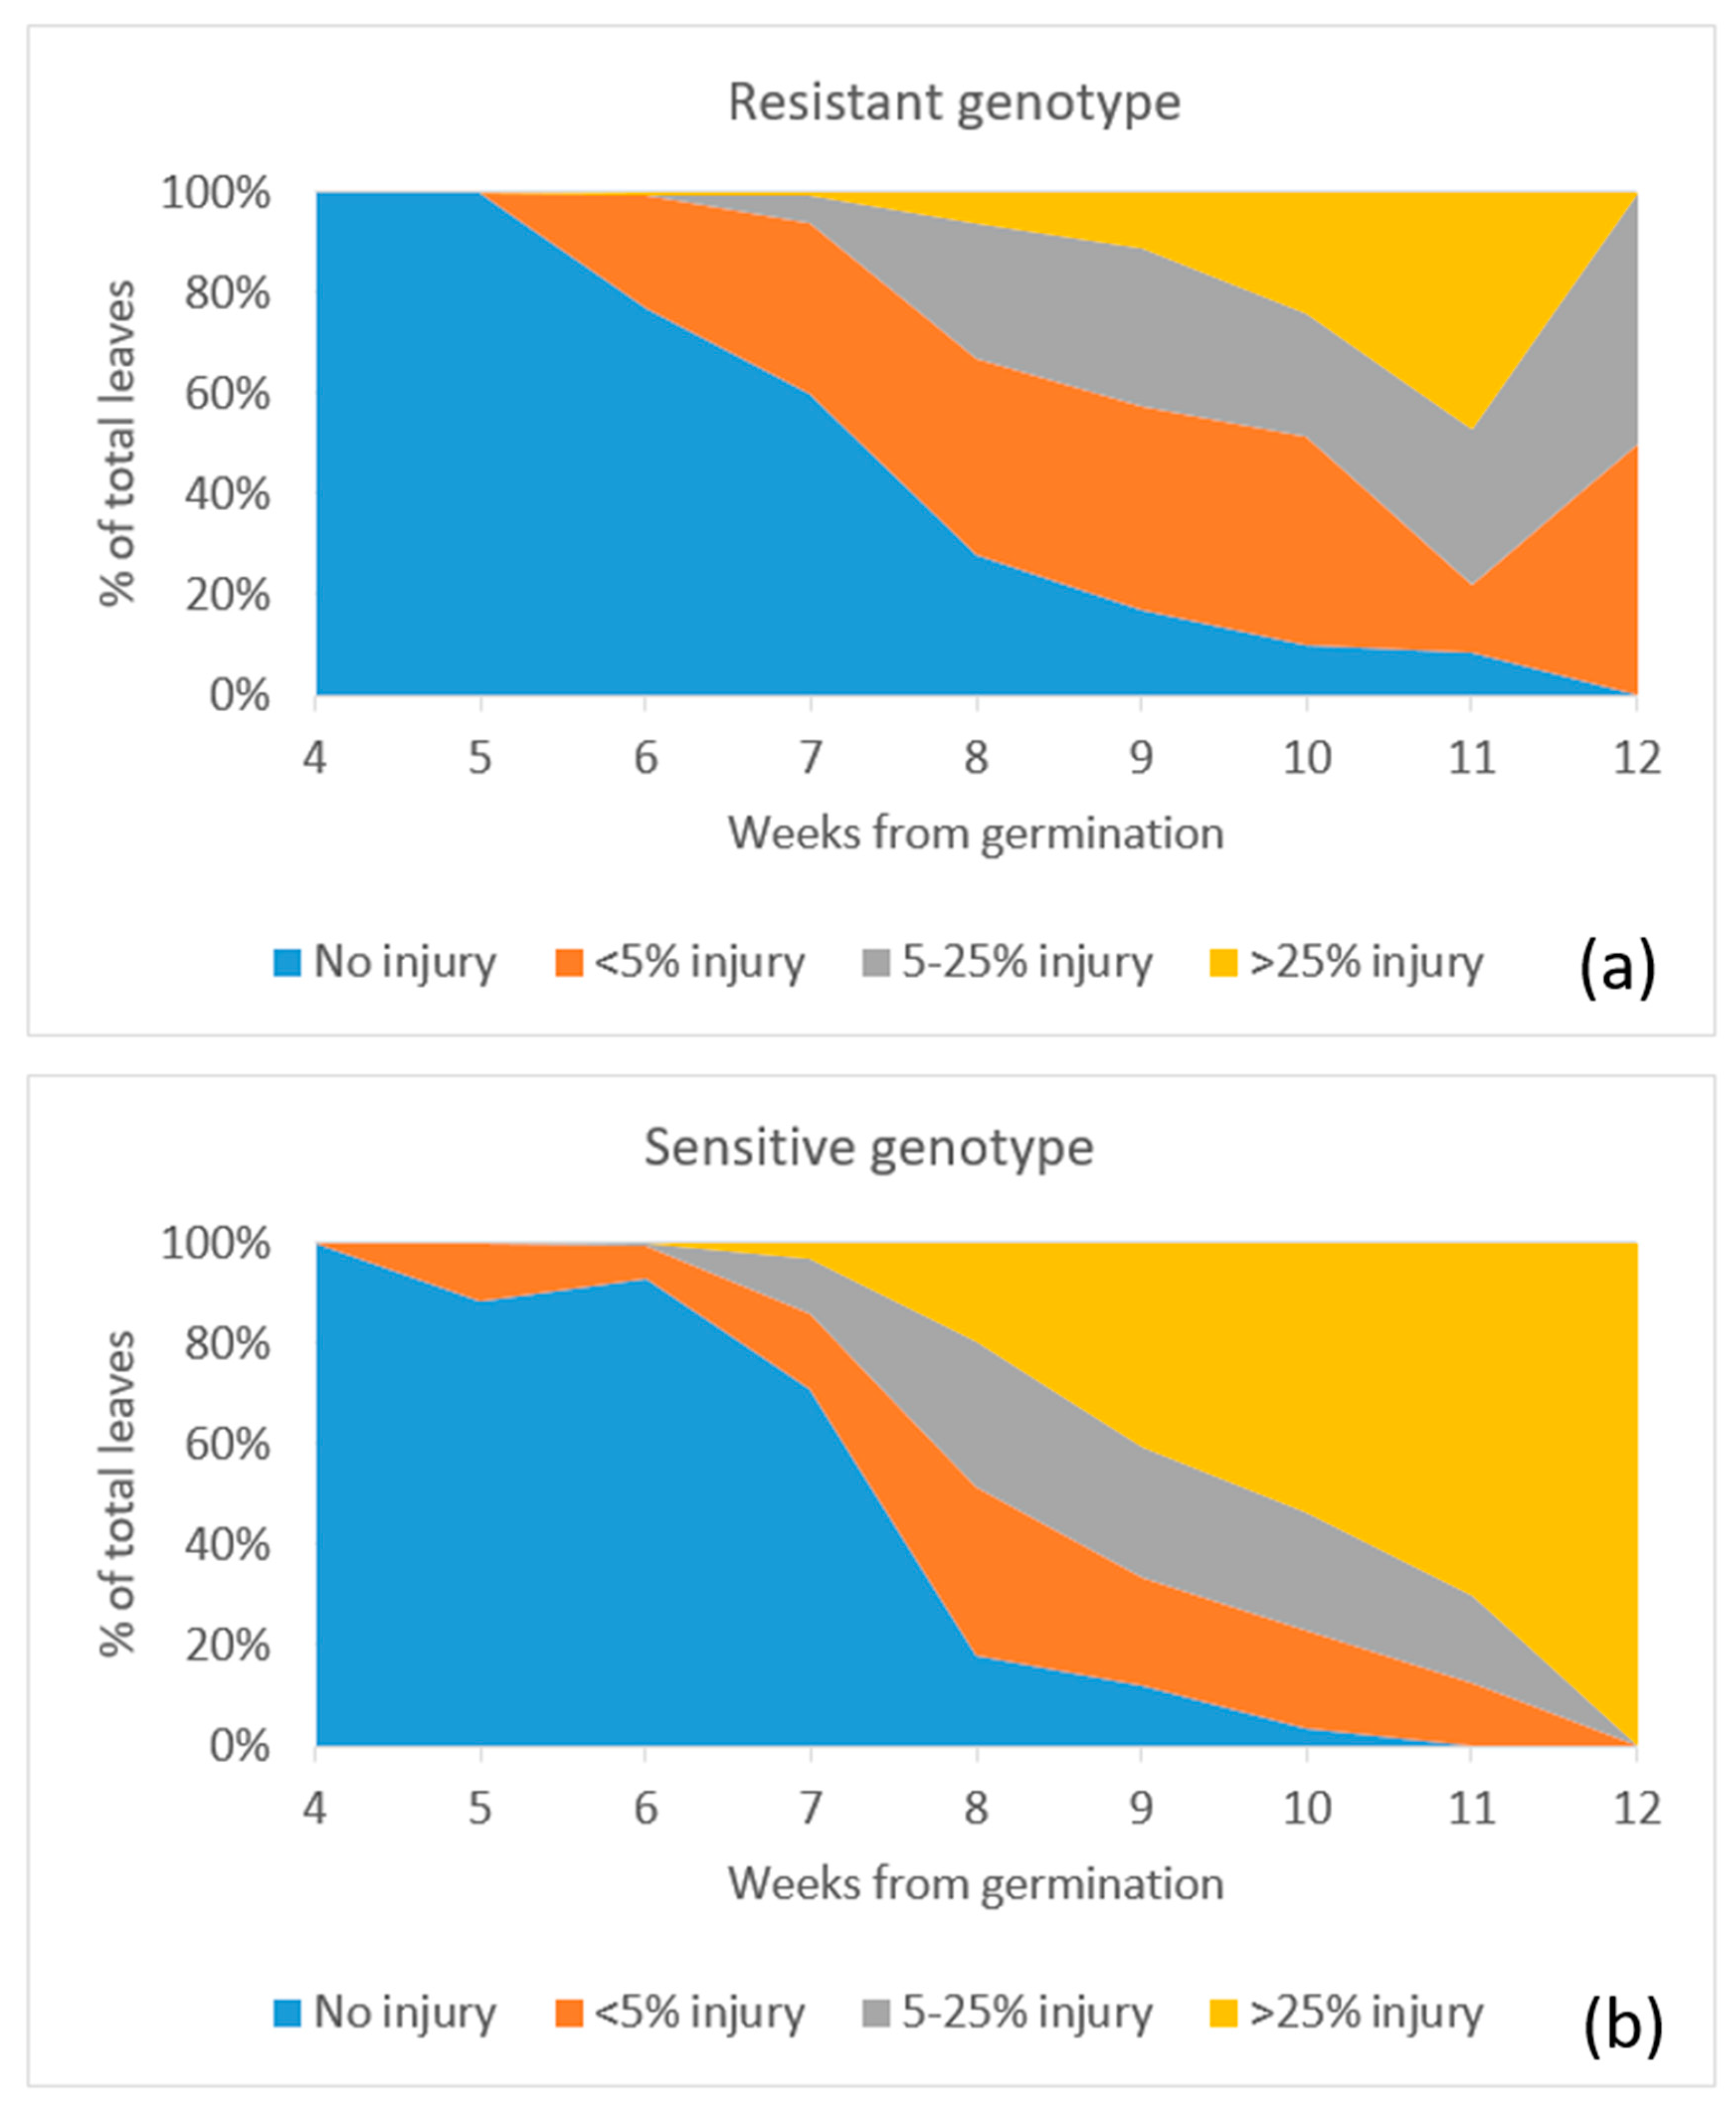
Although the sensitive genotype shows a higher yield than the resistant one, the sensitive genotype shows a higher level of O3-induced visible foliar injury than the resistant one (Figure 4). O3 injury first appeared as a small patch of mottles on the leaf surface and, then, more mottles would appear and join to form a larger patch. The injured leaf later became dried, turned yellowish, and eventually senesced. According to Figure 4 and Figure A4, the sensitive plants progress from no injury to moderate injury (>25%) more quickly (within one week) than the resistant one (over more than two weeks). The resistant genotype can recover by producing some new leaves from week eight and it reduces the percentage of leaves that are larger than 25% injury. This result is consistent with the studies by Elagoz et al. (2005) [29] and Hayes et al. (2019) [20], which also showed that higher O3 exposure led to higher occurrence of O3 injury in P. vulgaris.
There are several explanations for more severe O3-induced leaf injury on the sensitive plants from flowering stage onward (Figure 4) but a higher yield than the resistant genotype (Table 1). We investigated this by looking at possible external and internal factors. As an external factor, insect injuries were observed throughout the growing period and both resistant and sensitive plants suffered from insect injury on leaves and the pods. An insect proof net was installed but some small caterpillars and leafhoppers were still observed on the plants. We recorded the insect injury index and found no significant differences between the resistant and sensitive genotypes, and therefore insect injuries was not the cause for this phenomenon.
Flowering and fruit development are highly dependent on environmental factors. When plants experience environmental stress such as poor nutrition, low temperature, and high-intensity light, plant hormones such as phenylalanine ammonia lyase (PAL) increase in production and induce flowering [49]. This hormone is known as a flowering stimulus, and the gene responsible for the production of PAL has been identified and exists in many plants [49]. This stress-induced flowering allows the plant to produce more flowers, and therefore increase the chance of pollination and fruiting. It allows the plant to produce more seeds and to increase the chance of reproduction when the stress subsides and environmental conditions improve again. O3 is likely be one of the stresses that can induce flowering through this mechanism, and thus the sensitive genotype produces more flowers and seeds as a coping mechanism.
The sensitive genotype has a higher stomatal conductance due to its genetic variation [40,50], and therefore more O3 can enter into the stomata because of its higher conductance, and as a result cause more injuries [51,52]. When the O3 level is low, the sensitive plant is more productive as it has a higher photosynthesis rate because of faster CO2 uptake through the stomata. The warm and humid climate of Hong Kong also leads to a higher stomatal conductance and photosynthesis rate of P. vulgaris. However, the plant also takes up O3 through the stomata at the same time, resulting in foliar injuries and possible yield loss. It is likely that the O3 concentration in Hong Kong from January to April are not high enough for the sensitive genotypes to display a reduction of yield. This phenomenon is also observed in soybean which showed that high yield varieties of soybean are more sensitive to O3 because of selective breeding that favors high yield and high stomatal conductance cultivars [53]. Our results are indeed consistent with the findings of Burkey et al. (2012) [50], who concluded that under ambient O3 environment, only highly managed plots with optimal nutrients and irrigation were able to detect O3 impact on yield, where the seasonal mean O3 concentration was less than 50 ppb. In our study, since the majority of the growing period had an O3 concentration below 50 ppb (Figure 3), it is likely the reason why the sensitive genotypes did not show significant yield losses.
The relationship between leaf injury and yield is not currently fully understood. It is assumed that a less injured leaf has a higher leaf area index (LAI), which would be more productive and produce higher yield. However, recent studies from Srinivasan et al. (2017) showed that cultivars of soybean with lower LAI produced around 8% higher yield than the modern cultivar that had higher LAI [54]. This was because the modern cultivar was optimized for producing more leaves instead of a higher yield [54]. This suggests that physically removing a certain amount of leaves or presence of injured leaves would increase the energy use efficiency of crops, and therefore increase overall crop yield.
One of the limitations of this study is that we only had 24 individual plants, 12 for each genotype, which are not be able to give a statistically significant set of results due to a relatively small sample size. Therefore, continuation of the experiment with a larger number of plants is warranted. This study focused on foliar injuries and yields, but other physiological traits such as stomatal conductance, LAI, and photosynthesis rate would be highly useful for a more comprehensive evaluation of O3 impacts on plants in a subtropical city.
On the basis of the results of this study and generalizing results from previous studies [21,22,41,55], we could devise a framework for using sensitive and resistant Phaseolus vulgaris genotypes to provide information about O3 concentration and its phytotoxicity for a great variety of locations. For future studies, we would need a larger sample size and more experiments that are exposed to a larger range of O3 concentration, possibly with a chamber setup. The results of this ambient O3 study serve to verify that in sites where ozone concentration falls between 30 and 50 ppb on average, both genotypes suffer from ozone-induced foliar injury while the sensitive genotype yields more fruits than the resistant genotype. This framework allows gardeners, foresters and farmers to understand and reference O3 pollution impacts on trees and crops easily, and it can provide a useful guideline in estimating O3 concentrations and air quality without continuous and sophisticated pollution monitoring equipment. As part of the growing network of Ozone Gardens worldwide [22,34,42,56,57,58], the setup of this study could be a valuable reference for cross-city comparisons of O3 impacts, and contribute to both local and global educational efforts to help the public visualize and understand the impacts of air pollution.
5. Conclusions
In this exploratory study, we find evidence that ambient O3 levels in Hong Kong cause a higher intensity of visible foliar injury on leaves of the sensitive genotype than the resistant genotype of Phaseolus vulgaris. The O3 concentration in Hong Kong is high enough to induce foliar injury and the stress-induced flowering and fruiting for sensitive genotypes, but not high enough to create significant yield losses. For the first time in a subtropical city such as Hong Kong, this study highlights the value of Phaseolus vulgaris as a bioindicator for O3 pollution, with both foliar injury and yield being useful indicators,. We also recommend that future studies with a larger sample size and exposure of specific O3 concentration in a controlled environment would be useful to investigate the relationship of O3 level and visible foliar damage.
Author Contributions
All authors were involved in designing and discussing the study. A.P.K.T. was the principal investigator of the project; F.L., J.Y.S.P., D.K.C.T., and T.L. collected the required data and undertook the data analysis; F.L. and A.P.K.T. drafted the manuscript and contributed to the writing of the paper; A.P.K.T. and K.S. revised the manuscript and edited the language. All authors have read and agreed to the published version of the manuscript.
Funding
This research was funded by the Research Sustainability of Major RGC Funding Schemes of The Chinese University of Hong Kong (Project No.: 3133189) and the Vice-Chancellor’s Discretionary Fund of The Chinese University of Hong Kong (Project No.: 4930744).
Acknowledgments
We would like to acknowledge Gina Mills, Harry Harmens, Felicity Hayes and Katrina Sharp from the Centre for Ecology and Hydrology, Bangor, UK for providing the seeds of Phaseolus vulgaris and their support in ICP Vegetation Asia. We would also like to thank the Institute of Environment, Energy and Sustainability, The Chinese University of Hong Kong for supporting this project. We would also like to acknowledge the help from Mr Sam Chan of the State Key Laboratory of Agrobiotechnology who assisted us setting up the equipment and maintaining the Gene Garden at CUHK.
Conflicts of Interest
The authors declare no conflict of interest. The funders had no role in the design of the study; in the collection, analyses, or interpretation of data; in the writing of the manuscript, or in the decision to publish the results.
Appendix A
Figure A1.
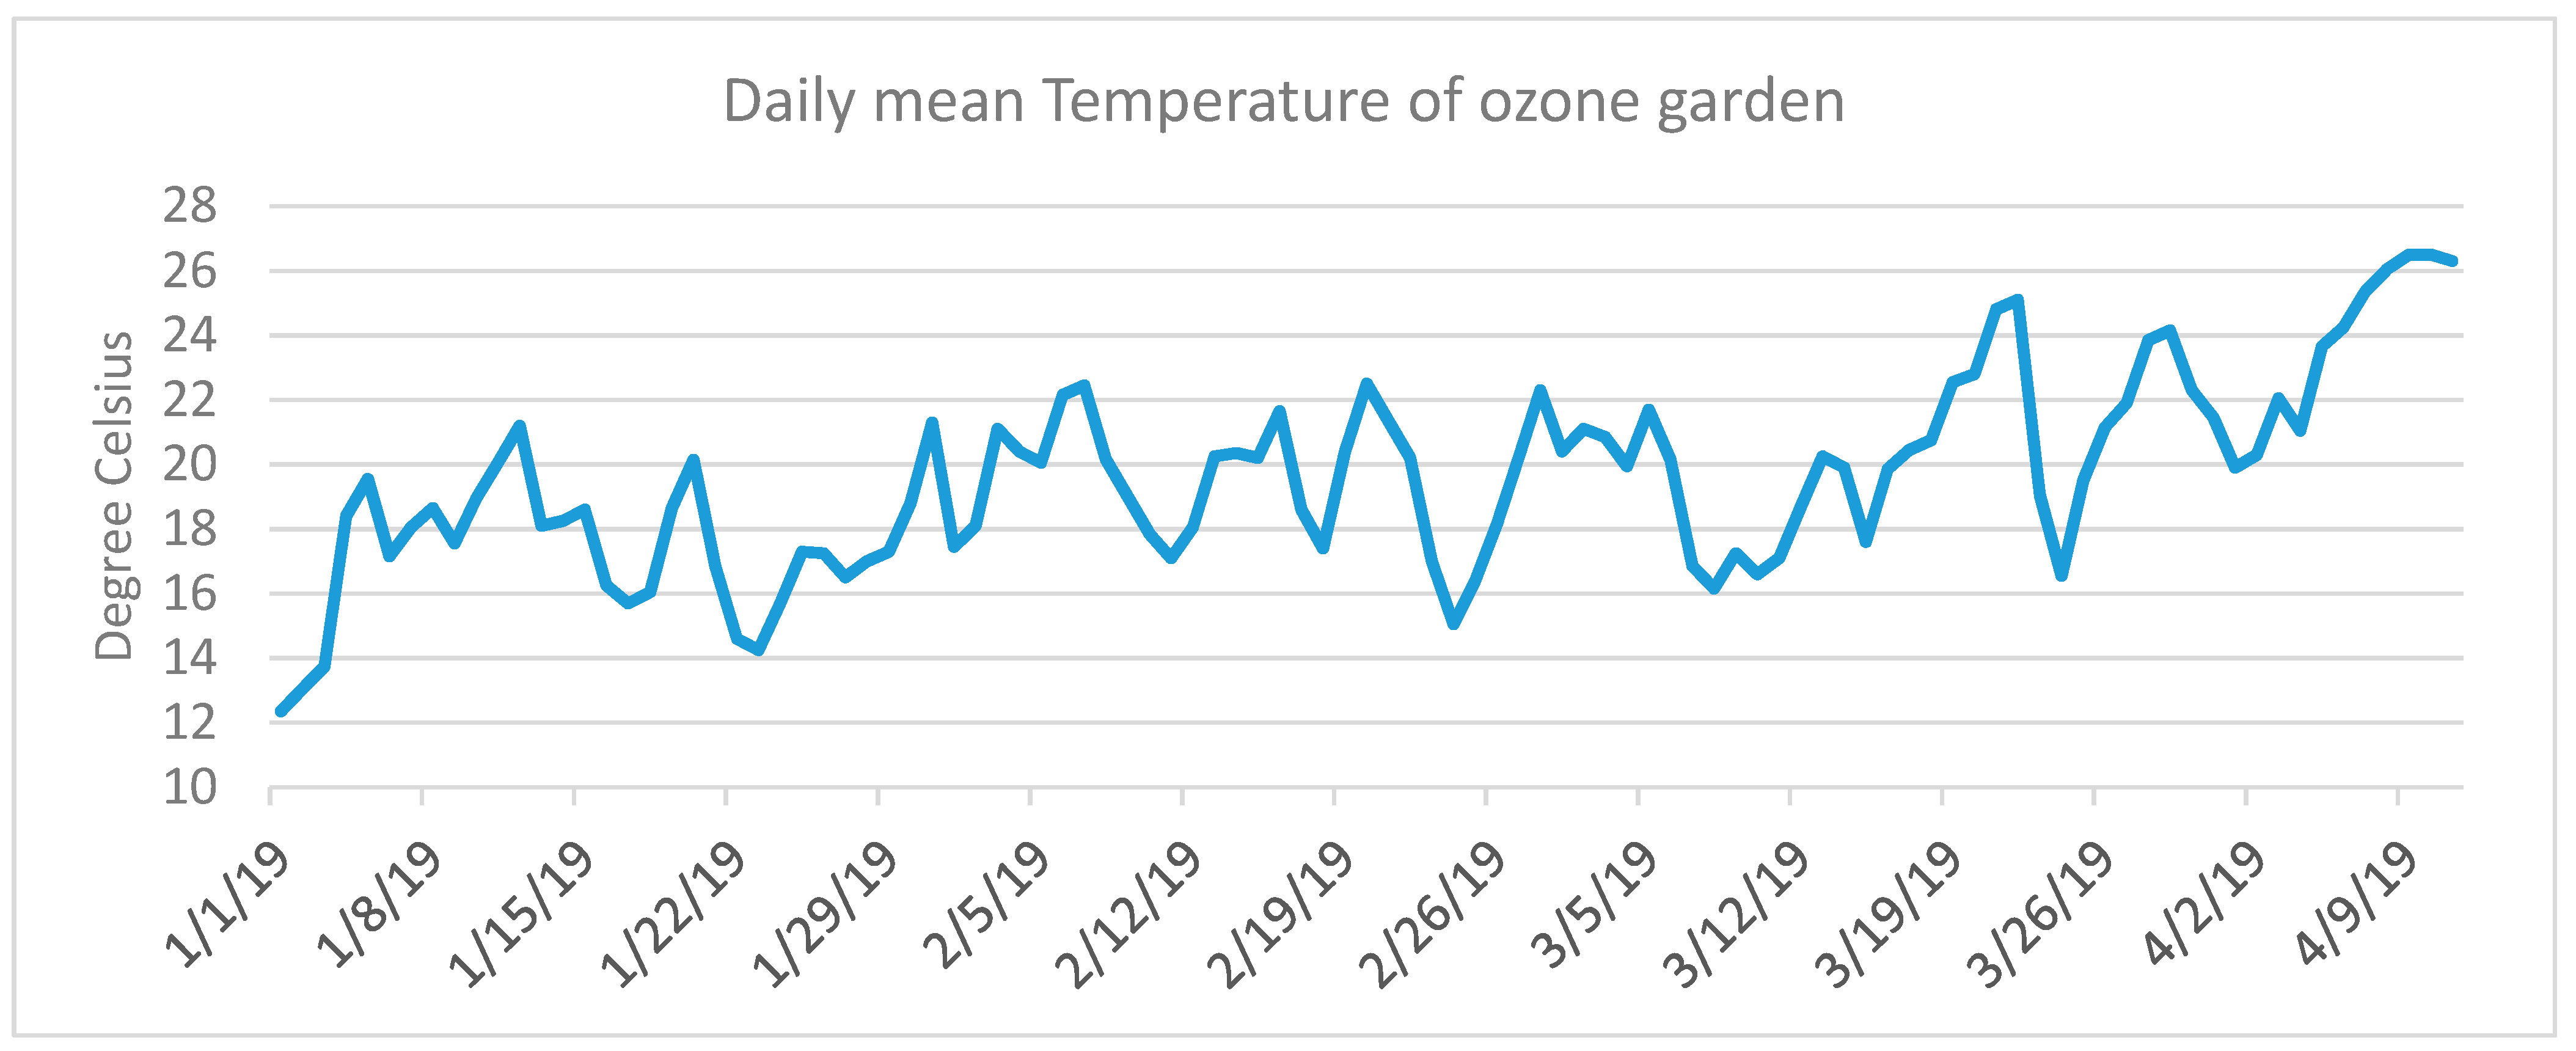
Daily mean temperature recorded at the Ozone Garden (latitude 22.4248°, longitude 114.2068°) from 1 January to 10 April 2019.
Figure A1.
Daily mean temperature recorded at the Ozone Garden (latitude 22.4248°, longitude 114.2068°) from 1 January to 10 April 2019.


Table A1.
Relative humidity and total rainfall of the growing period in 2019 recorded at the Ozone Garden (latitude 22.4248°, longitude 114.2068°).
Table A1.
Relative humidity and total rainfall of the growing period in 2019 recorded at the Ozone Garden (latitude 22.4248°, longitude 114.2068°).
| Month | Average Relative Humidity % | Total Rainfall (mm) |
|---|---|---|
| January | 76 | 4.7 |
| February | 82.5 | 68.7 |
| March | 85 | 186.5 |
| April | 80.5 | 185.8 |
Figure A2.
Setup of the 24 pots of Phaseolus vulgaris. The resistant and sensitive genotype pots are placed randomly.
Figure A2.
Setup of the 24 pots of Phaseolus vulgaris. The resistant and sensitive genotype pots are placed randomly.

Figure A3.
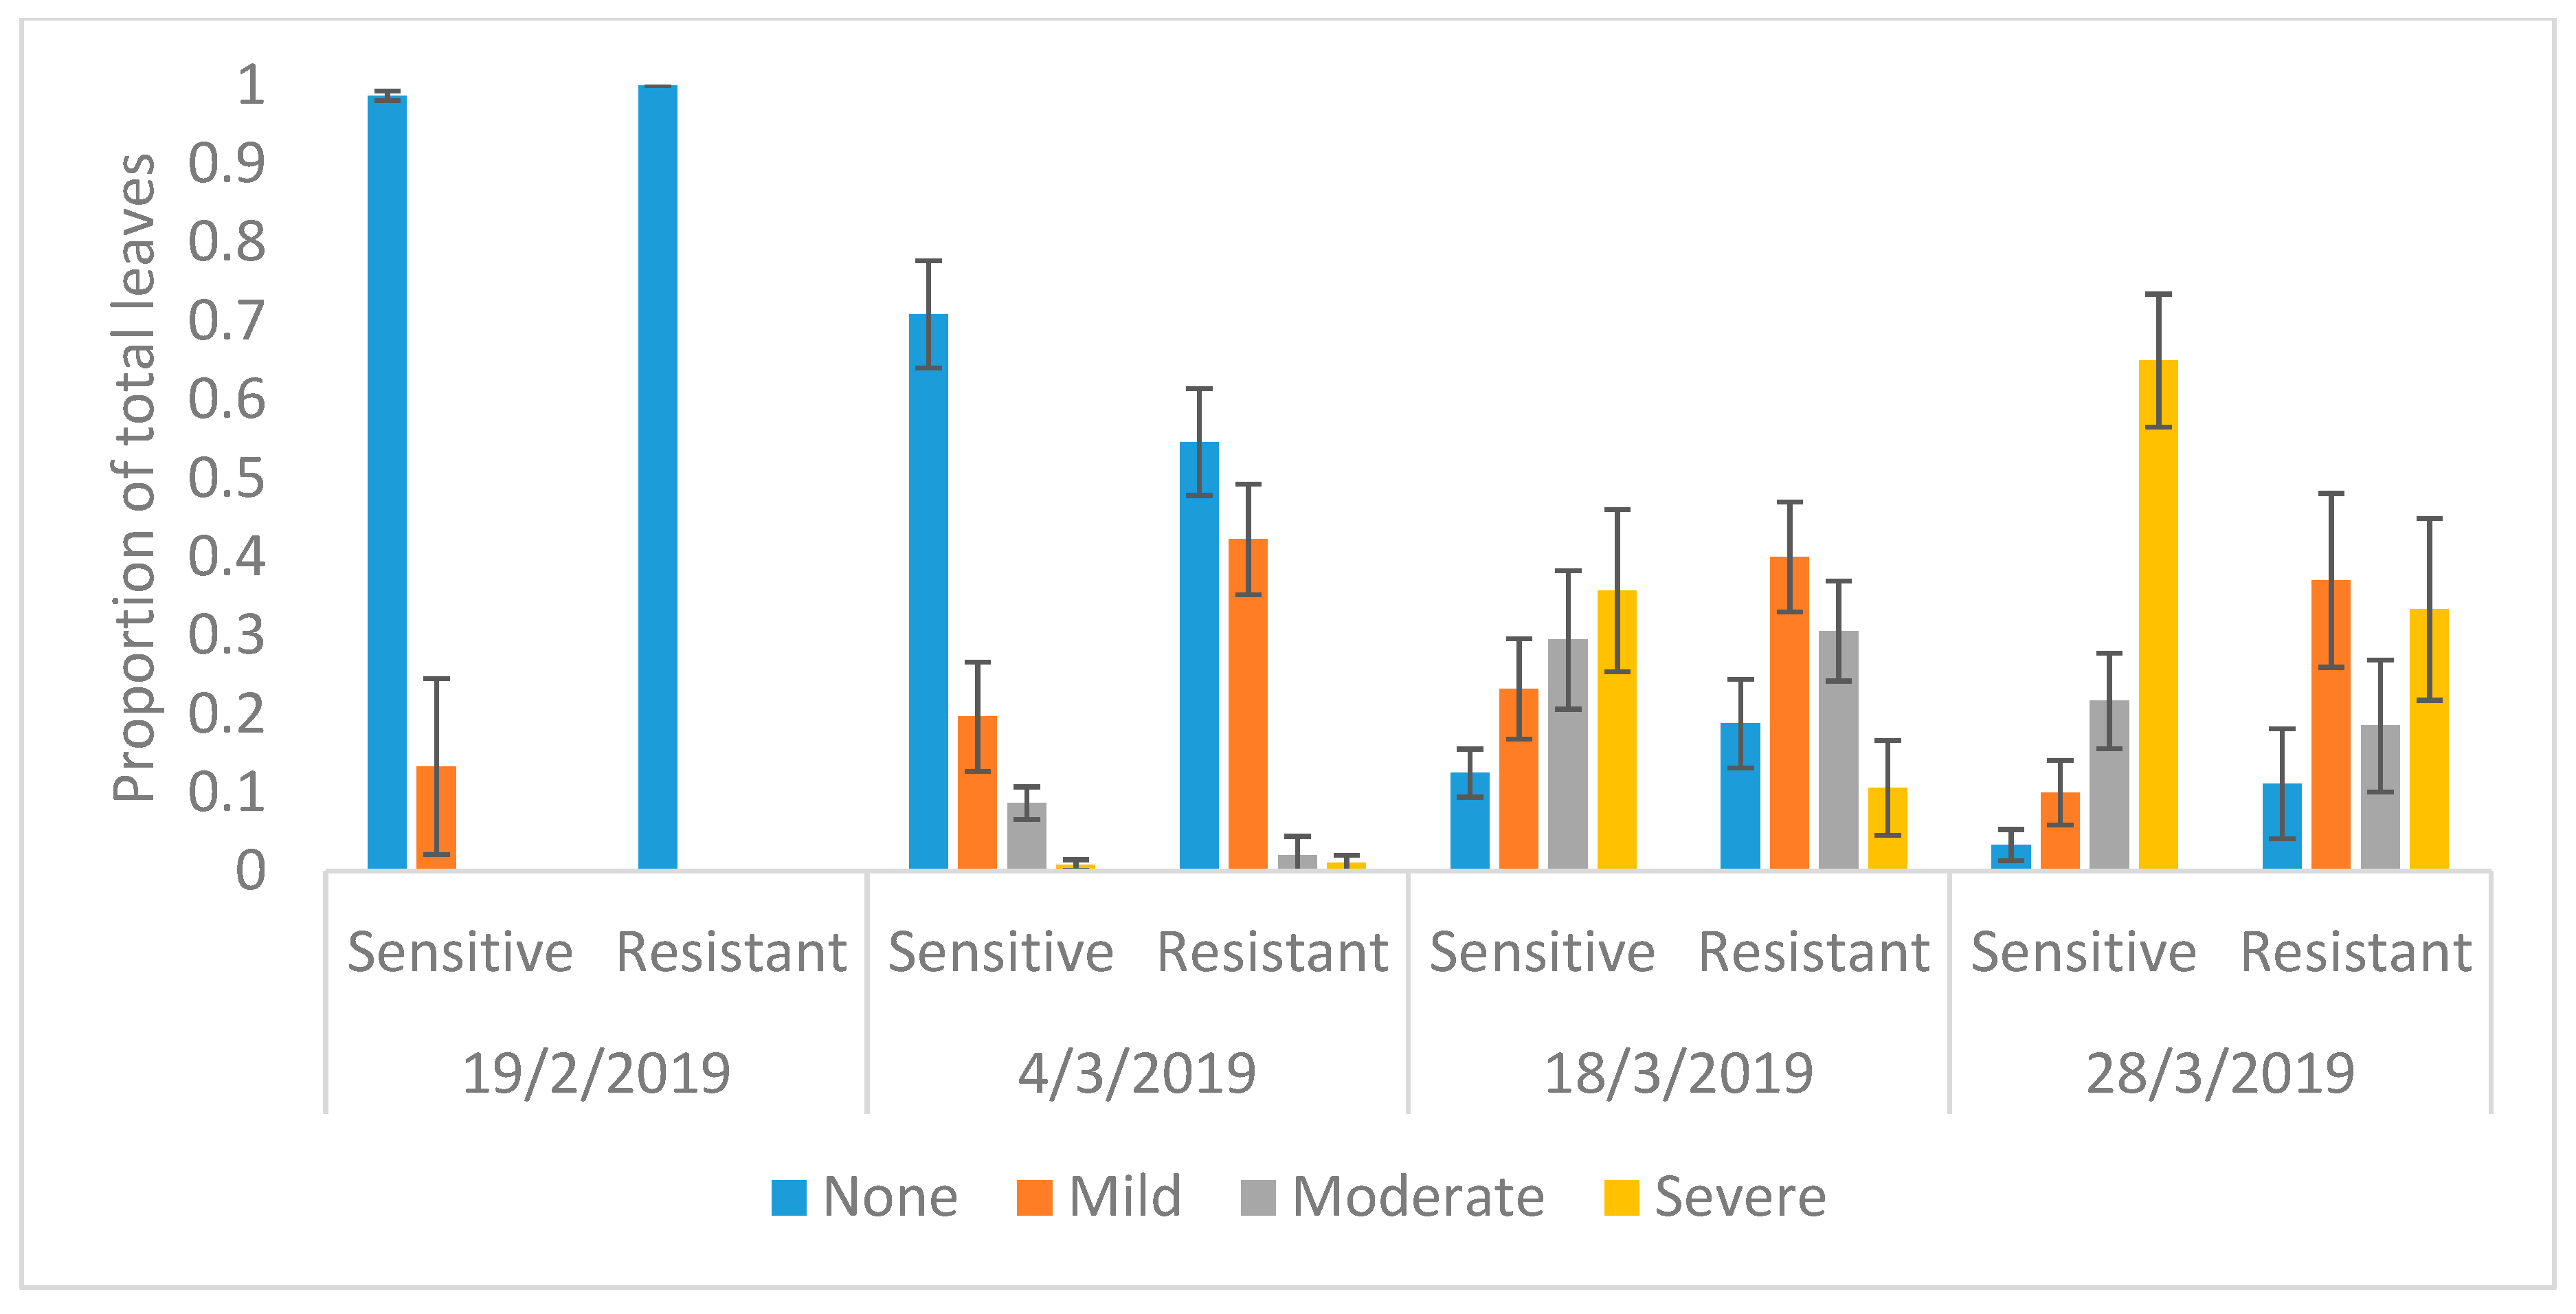
Average proportion of the total number of leaves per genotype showing leaf injury due to O3 damage in Phaseolus vulgaris. None is no O3 injury, mild is <5% injury, moderate is 5% to 25% injury, and severe is >25% injury. Standard error is shown.
Figure A3.
Average proportion of the total number of leaves per genotype showing leaf injury due to O3 damage in Phaseolus vulgaris. None is no O3 injury, mild is <5% injury, moderate is 5% to 25% injury, and severe is >25% injury. Standard error is shown.

Table A2.
Aikaike information criterion (AIC) for the two multinominal logistic models used to calculate the predicted probability of O3 injury of Phaseolus vulgaris. The model with the lowest AIC is the optimal model. Models differing in >2 AIC from the optimal model have little empirical support.
Table A2.
Aikaike information criterion (AIC) for the two multinominal logistic models used to calculate the predicted probability of O3 injury of Phaseolus vulgaris. The model with the lowest AIC is the optimal model. Models differing in >2 AIC from the optimal model have little empirical support.
| Dates | Multinom (Injury~Genotype) | Multinom (Injury~1) |
|---|---|---|
| 19 February 2019 | 22.62 | 18.04 |
| 4 March 2019 | 378.12 | 388.55 |
| 18 March 2019 | 528.96 | 542.21 |
| 28 March 2019 | 196.29 | 202.56 |
Figure A4.
Percentage of O3-induced visible foliar injury according to the injury index from germination to harvest for resistant (a) and sensitive (b) genotype of Phaseolus vulgaris. The date of the first week is 4 January 2019 and the fourth week is 19 February 2019.
Figure A4.
Percentage of O3-induced visible foliar injury according to the injury index from germination to harvest for resistant (a) and sensitive (b) genotype of Phaseolus vulgaris. The date of the first week is 4 January 2019 and the fourth week is 19 February 2019.

Table A3.
The total number of leaves per genotype per O3-induced visible foliar injury according to the injury index from the growing stage to harvest for Phaseolus vulgaris. Post-hoc paired t-test was carried out with 12 simulated samples and the p-value is shown.
Table A3.
The total number of leaves per genotype per O3-induced visible foliar injury according to the injury index from the growing stage to harvest for Phaseolus vulgaris. Post-hoc paired t-test was carried out with 12 simulated samples and the p-value is shown.
| Date | Genotype | None (0%) | Mild (<5%) | Moderate (5% to 25%) | Severe (>25%) |
|---|---|---|---|---|---|
| 19/02/2019 | Sensitive | 74 | 1 | 0 | 0 |
| Resistant | 77 | 0 | 0 | 0 | |
| 4/03/2019 | Sensitive | 90 | 25 | 11 | 1 |
| Resistant | 53 | 41 | 2 | 1 | |
| t-value | −8.24 | 13.14 | −4.55 | −0.39 | |
| p-value | <0.01 | <0.01 | <0.01 | 0.7 | |
| 18/03/2019 | Sensitive | 14 | 26 | 33 | 40 |
| Resistant | 16 | 34 | 26 | 9 | |
| t-value | 4.58 | 8.39 | 1.34 | −20.14 | |
| p-value | <0.01 | <0.01 | 0.21 | <0.01 | |
| 28/03/2019 | Sensitive | 2 | 6 | 13 | 39 |
| Resistant | 3 | 10 | 5 | 9 | |
| t-value | 5.5 | 11.5 | −2.48 | −6.97 | |
| p-value | <0.01 | <0.01 | 0.03 | <0.01 |
References
- Tai, A.P.K.; Martin, M.V.; Heald, C.L. Threat to future global food security from climate change and ozone air pollution. Nat. Clim. Chang. 2014, 4, 817–821. [Google Scholar] [CrossRef] [Green Version]
- Tai, A.P.K.; Val Martin, M. Impacts of ozone air pollution and temperature extremes on crop yields: Spatial variability, adaptation and implications for future food security. Atmos. Environ. 2017, 169, 11–21. [Google Scholar] [CrossRef]
- Ainsworth, E.A.; Yendrek, C.R.; Sitch, S.; Collins, W.J.; Emberson, L.D. The Effects of Tropospheric Ozone on Net Primary Productivity and Implications for Climate Change. Annu. Rev. Plant Biol. 2012, 63, 637–661. [Google Scholar] [CrossRef] [PubMed] [Green Version]
- Huntingford, C.; Cox, P.M.; Mercado, L.M.; Sitch, S.; Bellouin, N.; Boucher, O.; Gedney, N. Highly contrasting effects of different climate forcing agents on terrestrial ecosystem services. Philos. Trans. A. Math. Phys. Eng. Sci. 2011, 369, 2026–2037. [Google Scholar] [CrossRef] [PubMed] [Green Version]
- Sadiq, M.; Tai, A.P.K.; Lombardozzi, D.; Val Martin, M. Effects of ozone–vegetation coupling on surface ozone air quality via biogeochemical and meteorological feedbacks. Atmos. Chem. Phys. 2017, 17, 3055–3066. [Google Scholar] [CrossRef] [Green Version]
- Zhao, C.; Wang, Y.; Zeng, T. East China plains: A “basin” of ozone pollution. Environ. Sci. Technol. 2009, 43, 1911–1915. [Google Scholar] [CrossRef]
- Lu, X.; Hong, J.; Zhang, L.; Cooper, O.R.; Schultz, M.G.; Xu, X.; Wang, T.; Gao, M.; Zhao, Y.; Zhang, Y. Severe Surface Ozone Pollution in China: A Global Perspective. Environ. Sci. Technol. Lett. 2018, 5, 487–494. [Google Scholar] [CrossRef]
- Ng, E.; Chen, L.; Wang, Y.; Yuan, C. A study on the cooling effects of greening in a high-density city: An experience from Hong Kong. Build. Environ. 2012, 47, 256–271. [Google Scholar] [CrossRef]
- The Royal Society Ground-level ozone in the 21st century: Future trends, impacts and policy implications. Sci. Policy 2008, 15, 1–148.
- Conklin, P.L.; Barth, C. Ascorbic acid, a familiar small molecule intertwined in the response of plants to ozone, pathogens, and the onset of senescence. Plant. Cell Environ. 2004, 27, 959–970. [Google Scholar] [CrossRef]
- Feng, Z.; Pang, J.; Nouchi, I.; Kobayashi, K.; Yamakawa, T.; Zhu, J. Apoplastic ascorbate contributes to the differential ozone sensitivity in two varieties of winter wheat under fully open-air field conditions. Environ. Pollut. 2010, 158, 3539–3545. [Google Scholar] [CrossRef] [PubMed]
- Turcsányi, E.; Lyons, T.; Plöchl, M.; Barnes, J. Does ascorbate in the mesophyll cell walls form the first line of defence against ozone? Testing the concept using broad bean (Vicia faba L.). J. Exp. Bot. 2000, 51, 901–910. [Google Scholar] [CrossRef] [PubMed]
- Ashmore, M.R. Assessing the future global impacts of ozone on vegetation. Plant, Cell Environ. 2005, 28, 949–964. [Google Scholar] [CrossRef]
- Emberson, L.D.; Büker, P.; Ashmore, M.R. Assessing the risk caused by ground level ozone to European forest trees: A case study in pine, beech and oak across different climate regions. Environ. Pollut. 2007, 147, 454–466. [Google Scholar] [CrossRef] [PubMed]
- Li, P.; Mane, S.P.; Sioson, A.A.; Robinet, C.V.; Heath, L.S.; Bohnert, H.J.; Grene, R. Effects of chronic ozone exposure on gene expression in Arabidopsis thaliana ecotypes and in Thellungiella halophila. Plant Cell Environ. 2006, 29, 854–868. [Google Scholar] [CrossRef] [PubMed] [Green Version]
- Wrzaczek, M.; Brosché, M.; Salojärvi, J.; Kangasjärvi, S.; Idänheimo, N.; Mersmann, S.; Robatzek, S.; Karpiński, S.; Karpińska, B.; Kangasjärvi, J. Transcriptional regulation of the CRK/DUF26 group of receptor-like protein kinases by ozone and plant hormones in Arabidopsis. BMC Plant Biol. 2010, 10, 95. [Google Scholar] [CrossRef] [Green Version]
- Vahisalu, T.; Puzõrjova, I.; Brosché, M.; Valk, E.; Lepiku, M.; Moldau, H.; Pechter, P.; Wang, Y.-S.; Lindgren, O.; Salojärvi, J.; et al. Ozone-triggered rapid stomatal response involves the production of reactive oxygen species, and is controlled by SLAC1 and OST1. Plant J. 2010, 62, 442–453. [Google Scholar] [CrossRef]
- Wilkinson, S.; Davies, W.J. Drought, ozone, ABA and ethylene: New insights from cell to plant to community. Plant. Cell Environ. 2010, 33, 510–525. [Google Scholar] [CrossRef]
- Lindroth, R.L. Impacts of elevated atmospheric CO2 and O3 on forests: Phytochemistry, trophic interactions, and ecosystem dynamics. J. Chem. Ecol. 2010, 36, 2–21. [Google Scholar] [CrossRef]
- Hayes, F.; Sharps, K.; Harmens, H.; Roberts, I.; Mills, G. Tropospheric ozone pollution reduces the yield of African crops. J. Agron. Crop Sci. 2019, 12376. [Google Scholar] [CrossRef]
- Piraino, F.; Aina, R.; Palin, L.; Prato, N.; Sgorbati, S.; Santagostino, A.; Citterio, S. Air quality biomonitoring: Assessment of air pollution genotoxicity in the Province of Novara (North Italy) by using Trifolium repens L. and molecular markers. Sci. Total Environ. 2006, 372, 350–359. [Google Scholar] [CrossRef] [PubMed]
- Klumpp, A.; Ansel, W.; Klumpp, G.; Belluzzo, N.; Calatayud, V.; Chaplin, N.; Garrec, J.P.; Gutsche, H.J.; Hayes, M.; Hentze, H.W.; et al. EuroBionet: A Pan-European biomonitoring Network for Urban Air Quality Assessment. Environ. Sci. Pollut. Res. 2002, 9, 199–203. [Google Scholar] [CrossRef] [PubMed]
- Scerbo, R.; Ristori, T.; Possenti, L.; Lampugnani, L.; Barale, R.; Barghigiani, C. Lichen (Xanthoria parietina) biomonitoring of trace element contamination and air quality assessment in Pisa Province (Tuscany, Italy). Sci. Total Environ. 2002, 286, 27–40. [Google Scholar] [CrossRef]
- Urbat, M.; Lehndorff, E.; Schwark, L. Biomonitoring of air quality in the Cologne conurbation using pine needles as a passive sampler—Part I: Magnetic properties. Atmos. Environ. 2004, 38, 3781–3792. [Google Scholar] [CrossRef]
- Harmens, H.; Norris, D.; Mills, G. Heavy Metals and Nitrogen in Mosses: Spatial Patterns in 2010/2011 and Long-Term Temporal Trends in Europe; NERC/Centre for Ecology & Hydrology: Bangor, UK, 2013. [Google Scholar]
- Kandziora-Ciupa, M.; Nadgórska-Socha, A.; Barczyk, G.; Ciepał, R. Bioaccumulation of heavy metals and ecophysiological responses to heavy metal stress in selected populations of Vaccinium myrtillus L. and Vaccinium vitis-idaea L. Ecotoxicology 2017, 26, 966–980. [Google Scholar] [CrossRef] [PubMed]
- Feng, Z.; Sun, J.; Wan, W.; Hu, E.; Calatayud, V. Evidence of widespread ozone-induced visible injury on plants in Beijing, China. Environ. Pollut. 2014, 193, 296–301. [Google Scholar] [CrossRef]
- Klumpp, A.; Ansel, W.; Klumpp, G.; Calatayud, V.; Pierre Garrec, J.; He, S.; Peñuelas, J.; Ribas, À.; Ro-Poulsen, H.; Rasmussen, S.; et al. Ozone pollution and ozone biomonitoring in European cities. Part I: Ozone concentrations and cumulative exposure indices at urban and suburban sites. Atmos. Environ. 2006, 40, 7963–7974. [Google Scholar] [CrossRef]
- Elagöz, V.; Manning, W.J. Responses of sensitive and tolerant bush beans (Phaseolus vulgaris L.) to ozone in open-top chambers are influenced by phenotypic differences, morphological characteristics, and the chamber environment. Environ. Pollut. 2005, 136, 371–383. [Google Scholar] [CrossRef]
- Krupa, S.V.; Manning, W.J. Atmospheric Ozone: Formation and Effects on Vegetation. Eur. PMC. 1988, 50, 101–137. [Google Scholar] [CrossRef]
- Krupa, S.; McGrath, M.T.; Andersen, C.P.; Booker, F.L.; Burkey, K.O.; Chappelka, A.H.; Chevone, B.I.; Pell, E.J.; Zilinskas, B.A. Ambient Ozone and Plant Health. Plant Dis. 2001, 85, 4–12. [Google Scholar] [CrossRef] [Green Version]
- Sitch, S.; Cox, P.M.; Collins, W.J.; Huntingford, C. Indirect radiative forcing of climate change through ozone effects on the land-carbon sink. Nature 2007, 448, 791–794. [Google Scholar] [CrossRef] [PubMed]
- Lombardozzi, D.; Levis, S.; Bonan, G.; Hess, P.G.; Sparks, J.P.; Lombardozzi, D.; Levis, S.; Bonan, G.; Hess, P.G.; Sparks, J.P. The Influence of Chronic Ozone Exposure on Global Carbon and Water Cycles. J. Clim. 2015, 28, 292–305. [Google Scholar] [CrossRef]
- Hayes, F.; Mills, G.; Harmens, H.; Norris, D. Evidence of Widespread Ozone Damage to Vegetation in Europe (1990–2006); ICP Vegetation Programme Coordination Centre: CEH Bangor, UK, 2007. [Google Scholar]
- Mills, G.; Hayes, F.; Simpson, D.; Emberson, L.; Norris, D.; Harmens, H.; Büker, P. Evidence of widespread effects of ozone on crops and (semi-)natural vegetation in Europe (1990–2006) in relation to AOT40- and flux-based risk maps. Glob. Chang. Biol. 2011, 17, 592–613. [Google Scholar] [CrossRef] [Green Version]
- Schaub, M.; Calatayud, V.; Ferreti, M.; Brunialti, G.; Lovblad, G.; Krause, G.; Sanz, M.J. Assessment of Ozone Injury. Manual on Methods and Criteria for Harmonized Sampling, Assessment, Monitoring and Analysis of the Effects of Air Pollution on Forests; UNECE ICP Forests Programme Co-ordinating Centre: Hamburg, Germany, 2010; Volume 1. [Google Scholar]
- Manning, W.J.; Godzik, B. Bioindicator plants for ambient ozone in Central and Eastern Europe. Environ. Pollut. 2004, 130, 33–39. [Google Scholar] [CrossRef] [PubMed]
- Umponstira, C.; Pimpa, W.; Nanegrungsun, S. Physiological and biochemical responses of cowpea (Vigna unguiculata (L.) Walp) to ozone. Songklanakarin J. Sci. Technol. 2006, 28, 861–869. [Google Scholar]
- Sanz, M.J.; Calvo, E. Ozone injury in crops. Available online: http://ozoneinjury.org (accessed on 17 January 2020).
- Reinert, R.A.; Eason, G. Genetic Control of O3 Sensitivity in a Cross Between Two Cultivars of Snap Bean. J. Am. Soc. Hort. Sci. 2000, 125, 222–227. [Google Scholar] [CrossRef]
- Burkey, K.O.; Miller, J.E.; Fiscus, E.L. Assessment of Ambient Ozone Effects on Vegetation Using Snap Bean as a Bioindicator Species. Publ. J. Environ. Qual 2005, 34, 1081–1086. [Google Scholar] [CrossRef]
- ICP Vegetation New Ozone Garden Project. Available online: https://icpvegetation.ceh.ac.uk/new-ozone-garden-project-hong-kong (accessed on 27 November 2019).
- ICP Vegetation “Seeing is Believing” Ozone injury on Phaseolus vulgaris (common bean). In Bean Biomonitoring Protocol. 2018. Available online: https://icpvegetation.ceh.ac.uk/get-involved/ozone-injury (accessed on 3 January 2019).
- Teledyne Model T400 Photometric Ozone Analyzer Manual. Available online: http://www.teledyne-api.com/prod/Downloads/T400 Manual - 06870.pdf (accessed on 11 November 2018).
- R Core Team. R: A language and environment for statistical computing. In R Foundation for Statistical Computing; 2018; Vienna, Austria. Available online: https://repo.bppt.go.id/cran/web/packages/dplR/vignettes/intro-dplR.pdf (accessed on 1 November 2019).
- Veneables, W.N.; Ripley, B.D. Modern Applied Statistics with S, 4th ed.; Springer: New York, NY, USA, 2002; ISBN 0-387-95457-0. [Google Scholar]
- Zuur, A.; Leno, E.N.; Walker, N.; Saveliev, A.A.; Smith, G.M. Mixed Effects Models and Extensions in Ecology with R, 1st ed.; Springer: New York, NY, USA, 2009; ISBN 978-0-387-87457-9. [Google Scholar]
- Burnham, K.P.; Anderson, D.R. Model Selection and Multimodel Inference : A Practical Information-Theoretic Approach, 2nd ed.; Springer: New York, NY, USA, 2002; ISBN 9781441929730. [Google Scholar]
- Wada, K.C.; Takeno, K. Stress-induced flowering. Plant Signal. Behav. 2010, 5, 944–947. [Google Scholar] [CrossRef]
- Burkey, K.O.; Booker, F.L.; Ainsworth, E.A.; Nelson, R.L. Field assessment of a snap bean ozone bioindicator system under elevated ozone and carbon dioxide in a free air system. Environ. Pollut. 2012, 166, 167–171. [Google Scholar] [CrossRef]
- Anav, A.; Proietti, C.; Menut, L.; Carnicelli, S.; De Marco, A.; Paoletti, E. Sensitivity of stomatal conductance to soil moisture: Implications for tropospheric ozone. Atmos. Chem. Phys 2018, 18, 5747–5763. [Google Scholar] [CrossRef] [Green Version]
- Reiling, K.; Davison, A.W.; Son, V.I. Effects of ozone on stomatal conductance and photosynthesis in populations of Plantago major L. New Phytol. 1995, 129, 587–594. [Google Scholar] [CrossRef]
- Osborne, S.A.; Mills, G.; Hayes, F.; Ainsworth, E.A.; Büker, P.; Emberson, L. Has the sensitivity of soybean cultivars to ozone pollution increased with time? An analysis of published dose-response data. Glob. Chang. Biol. 2016, 22, 3097–3111. [Google Scholar] [CrossRef] [PubMed] [Green Version]
- Srinivasan, V.; Kumar, P.; Long, S.P. Decreasing, not increasing, leaf area will raise crop yields under global atmospheric change. Glob. Chang. Biol. 2017, 23, 1626–1635. [Google Scholar] [CrossRef] [PubMed] [Green Version]
- Pringle, J.; Yu, C.; Sachs, M.; Ellis, R. Assessing ozone damage to cutleaf coneflower in an ozone bioindicator garden. J. Franklin Inst. 2018, 355, 6152–6168. [Google Scholar] [CrossRef]
- Fishman, J.; Creilson, J.K.; Parker, P.A.; Ainsworth, E.A.; Vining, G.G.; Szarka, J.; Booker, F.L.; Xu, X. An investigation of widespread ozone damage to the soybean crop in the upper Midwest determined from ground-based and satellite measurements. Atmos. Environ. 2010, 44, 2248–2256. [Google Scholar] [CrossRef]
- Holland, M.; Kinghorn, S.; Emberson, L.; Cinderby, S.; Ashmore, M.; Mills, G.E.; Harmens, H. Development of a framework for probabilistic assessment of the economic losses caused by ozone damage to crops in Europe. ICP Veg. Rep. Defra 2006, 205, 1–62. [Google Scholar]
- NASA Ozone Bioindicator Garden. Available online: https://airquality.gsfc.nasa.gov/ozone-bioindicator-garden (accessed on 27 November 2019).
Figure 1.
Insect injury index for bush bean. (a) No injury; (b) less than 5% insect injury; (c) 5% to 25% insect injury; and (d) greater than 25% insect injury. We also show in (d) a caterpillar eating the leaf.
Figure 1.
Insect injury index for bush bean. (a) No injury; (b) less than 5% insect injury; (c) 5% to 25% insect injury; and (d) greater than 25% insect injury. We also show in (d) a caterpillar eating the leaf.

Figure 2.
Ozone-induced visible foliar injury index. (a) No O3 injuries but with some insect injury; (b) less than 5% of ozone injuries on the trifoliates; (c) 5% to 25% of bronze patches indicating ozone injury on the leaves; (d) greater than 25% of ozone injuries; and (e) senesced leaf that is yellow instead of green, also showing previous ozone injuries [42].

Figure 3.
(a) Hourly ozone level in ppb and (b) daily mean O3 and 8 h mean ozone (9 a.m. to 5 p.m.) recorded at the Ozone Garden (latitude 22.4248° and longitude 114.2068°) from 1 January to 10 April 2019 using a Teledyne 400 ozone analyzer.
Figure 3.
(a) Hourly ozone level in ppb and (b) daily mean O3 and 8 h mean ozone (9 a.m. to 5 p.m.) recorded at the Ozone Garden (latitude 22.4248° and longitude 114.2068°) from 1 January to 10 April 2019 using a Teledyne 400 ozone analyzer.

Figure 4.
Predicted probability of O3-induced visible foliar injury according to the injury index from growing stage to harvest for resistant and sensitive genotype of Phaseolus vulgaris calculated using multinominal logistic regression model. None is no O3 injury, mild is <5% injury, moderate is 5% to 25% injury, and severe is >25% injury.

Table 1.
Effect of ambient ozone level on resistant and sensitive genotypes of Phaseolus vulgaris. Standard deviations, t-values, and the significance levels are also shown. * include pod with zero number of beans. Bolded p-value means statistically significance.
Table 1.
Effect of ambient ozone level on resistant and sensitive genotypes of Phaseolus vulgaris. Standard deviations, t-values, and the significance levels are also shown. * include pod with zero number of beans. Bolded p-value means statistically significance.
| Effect | Mean for Resistant Genotype ± 1 σ SD | Number of Replicates for Resistant | Mean for Sensitive Genotype ± 1 σ SD | Number of Replicates for Sensitive | t-Value | p-Value |
|---|---|---|---|---|---|---|
| Days from germination to harvest | 75.1 ± 7.5 | 12 | 78.8 ± 5 | 12 | −1.5 | 0.146 |
| Maximum flowering day | 37.9 ± 7.1 | 12 | 40.3 ±5.2 | 12 | −1.04 | 0.309 |
| Bean per plant | 10.7 ± 5.9 | 12 | 11.3 ± 8.4 | 12 | −0.17 | 0.667 |
| Bean per pod * | 3 ± 1.2 | 56 | 2.6 ± 1.36 | 71 | 1.37 | 0.172 |
| Bean dry weight (g) | 0.21 ± 0.06 | 128 | 0.24 ± 0.05 | 136 | −4.47 | <0.001 |
| Total bean weight per plant (g) | 2.09 ± 1.55 | 12 | 2.69 ± 1.85 | 12 | −0.84 | 0.412 |
| Maximum number of flowers | 8.01 ± 2 | 12 | 12.7 ± 6 | 12 | −2.55 | <0.001 |
| Maximum flowering day | 37.9 ± 7 | 12 | 40.3 ± 5.2 | 12 | −1.04 | 0.309 |
| Pod per plant | 4.9 ± 2.35 | 12 | 5.9 ± 3.0 | 12 | −1.04 | 0.214 |
Table 2.
Effect of ambient ozone level on resistant and sensitive genotypes of Phaseolus vulgaris. MFD is maximum flowering day. The Chi-square value and the significance level are shown. Bolded p-value means statistically significance.
Table 2.
Effect of ambient ozone level on resistant and sensitive genotypes of Phaseolus vulgaris. MFD is maximum flowering day. The Chi-square value and the significance level are shown. Bolded p-value means statistically significance.
| Effect | Count for Resistant Genotype | Count for Sensitive Genotype | χ2 | p-Value |
|---|---|---|---|---|
| Successful and (unsucessful) fruit development | 58 (32) | 74 (81) | 6.39 | <0.05 |
| Live and (dead) pod | 43 (15) | 56 (18) | 0.0410 | 0.840 |
| Leaves with <5% and (>=5%) insect injury at MFD | 86 (12) | 115 (10) | 1.11 | 0.291 |
© 2020 by the authors. Licensee MDPI, Basel, Switzerland. This article is an open access article distributed under the terms and conditions of the Creative Commons Attribution (CC BY) license (http://creativecommons.org/licenses/by/4.0/).
Share and Cite
MDPI and ACS Style
Leung, F.; Pang, J.Y.S.; Tai, A.P.K.; Lam, T.; Tao, D.K.C.; Sharps, K. Evidence of Ozone-Induced Visible Foliar Injury in Hong Kong Using Phaseolus Vulgaris as a Bioindicator. Atmosphere 2020, 11, 266. https://doi.org/10.3390/atmos11030266
AMA Style
Leung F, Pang JYS, Tai APK, Lam T, Tao DKC, Sharps K. Evidence of Ozone-Induced Visible Foliar Injury in Hong Kong Using Phaseolus Vulgaris as a Bioindicator. Atmosphere. 2020; 11(3):266. https://doi.org/10.3390/atmos11030266
Chicago/Turabian StyleLeung, Felix, Jacky Y. S. Pang, Amos P. K. Tai, Timothy Lam, Donald K. C. Tao, and Katrina Sharps. 2020. "Evidence of Ozone-Induced Visible Foliar Injury in Hong Kong Using Phaseolus Vulgaris as a Bioindicator" Atmosphere 11, no. 3: 266. https://doi.org/10.3390/atmos11030266
Note that from the first issue of 2016, this journal uses article numbers instead of page numbers. See further details here.