


RAPID CITY, S.D. – The jet stream is one of the most useful tools for meteorologists. With one image, or a series of images, we can gather a lot of information.
What is the jet stream?
The jet stream is a narrow band of fast flowing air in the upper atmosphere. Wind speeds can reach 250 mph or greater. Many pieces of information of current and upcoming weather conditions can be gathered from the pattern of the jet stream. There are actually two major jet streams that are tracked in the northern hemisphere: the polar jet stream and the sub tropical jet stream. In the spring and fall, these two jet streams can interact, making for some interesting weather patterns. In the summer, the sub tropical jet stream is farther north and dictates most of our weather. Whereas, in the winter, the polar jet stream moves south, which is responsible for the cold weather systems.
Where is the jet stream?
The jet stream is located between the troposphere (the lowest layer of the atmosphere where all of our weather happens) and the stratosphere (the layer that sits on top of the troposphere). It usually falls somewhere between 4 and 8 miles above the ground.
What information can the jet stream give us?
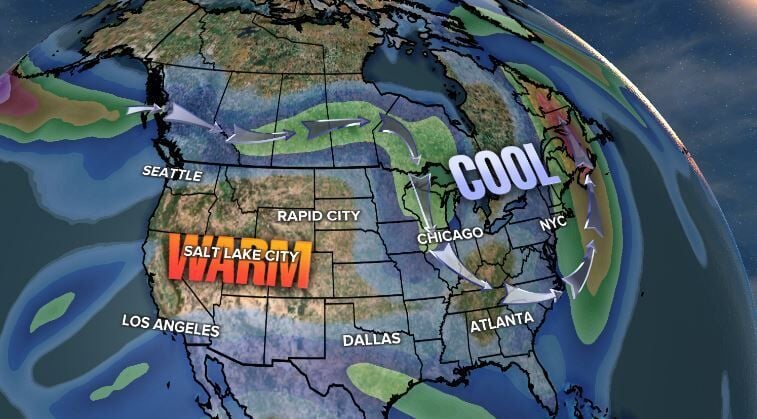
These three images are taken one to two days apart and are a good example of how the jet stream changes over time.
The first image shows a deep trough over the eastern U.S., which is when the jet stream curves down. The arrows show where the center of the jet stream is. Cooler temperatures are always located to the left of the jet stream, when you face the direction that the air is flowing, and warmer air is always located on the right. This pattern exists for more complicated reasons than is necessary to get into here, but if you’re interested in exploring the world of meteorology, check out this article on thermal wind balance.
The next important thing to point out is something called a jet streak. This is where there is a “bulls-eye” of faster moving wind within the jet stream. In the first image, there is a jet streak located just off the northeast coast. There is another one to the northwest of Washington. When we see troughs like this, we can expect to see unsettled weather to the east of the trough. This is where air at the surface is encouraged to rise, supporting the formation of precipitation. Pay attention to how the pattern changes from this image to the next.

Jet1
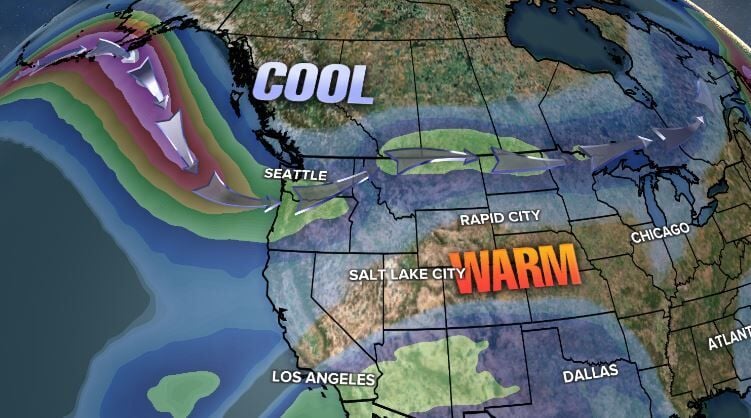
After only a day, this is how the jet stream has changed:

Jet2
The trough over the eastern portion of the country is no longer there. To explain this, let’s think of the jet stream like a rope that is rotating around the globe. When there is a jet streak on the east side of the trough, the “rope” (jet stream) gets pulled, and the jet stream flattens out. When the jet stream flattens out it means that there will be calmer weather because there isn’t as much upper-level support for the formation of low-pressure systems at the surface. Before moving on to the next image, pay attention to the jet streak off the coast of Washington.

Jet3
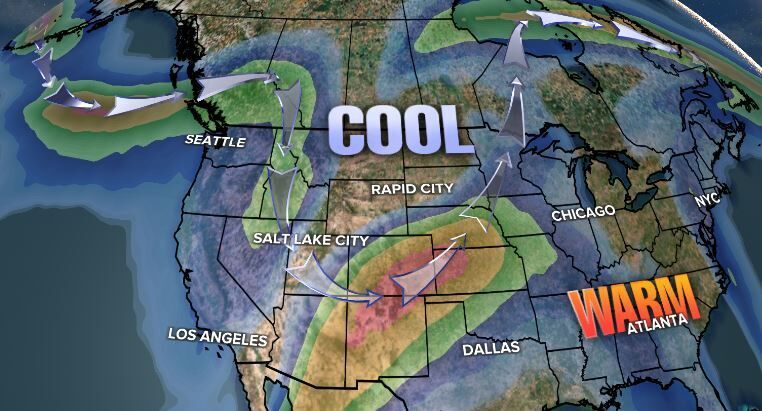
The jet streak from the previous image has pushed on the “rope,” causing a trough to form and move south into the U.S.. The jet streak is now located on the southeast edge of the trough. Jet streak also presents another piece of useful information. A jet streak can be separated into different regions: the entrance region (where air flows into the jet streak) and the exit region (where air flows out of the jet streak). When air speeds up, it spreads out, or diverges. When air slows down, it bunches up, or converges. For the jet stream, we look for areas of divergence, because when air above the surface diverges, the air at the surface has to converge and rise to fill the void left by air leaving the area above the surface. This is the premise that leads to the formation of low pressure systems at the surface. Now it’s not that simple, because if it were, we’d expect the the formation of surface low pressure systems directly under the entrance regions of jet streaks, but the opposite is true. The reason is that we haven’t covered the role that rotation plays. Low pressure systems rotate counter-clockwise in the northern hemisphere and the location where we typically see the most counter-clockwise rotation is in the exit region of jet streaks. A good way to tell if rising motion is favored is by using your right hand, and curling your fingers in the direction that the wind is curving. If your thumb points away from the map, rising motion is favored.
I know that this seems like a lot, but that’s because it is! Hopefully you now know enough to understand what you’re looking at when you see a map of the jet stream. Next time we get crazy weather in the Black Hills, you can thank the jet stream.